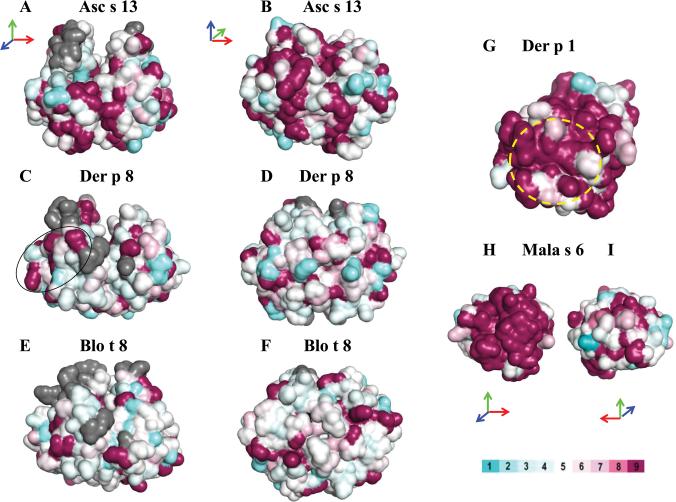
Figure 6. Surface residue comparisons.
Residue similarity of Asc s 13 (A, B), Der p 8 (C, D), and Blo t 8 (E, F) to Bla g 5. G) Der p 1 similarity to Der f 1, and epitope for cross-reactive mAb 4C1 (circle).37 H-I) Mala s 6 similarity to Cat r 1.23 Color bar represents residue similarity from low (light blue) to high (maroon) (Online Repository). Grey represents gaps or insertions in sequence alignment. Arrows indicate how the structures are rotated with respect to each other.

