
Figure 4.
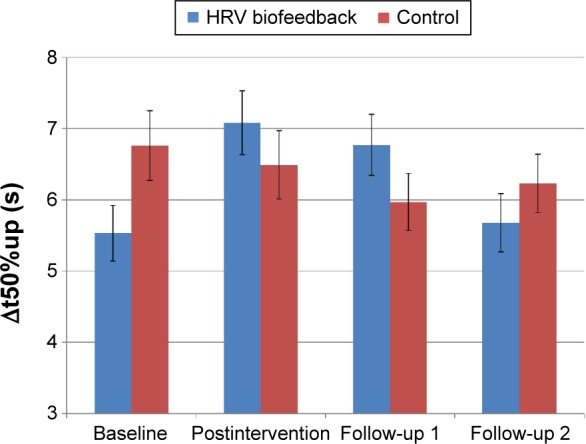
Vasomotor function: Δt50%up.
Notes: Δt50%up was unchanged in both the HRV biofeedback group and in the control group. Data are presented as mean±standard deviation. P=ns compared to baseline and control. HRV biofeedback: n=24; control: n=24. In the control group, the term “postintervention” refers to the post-control period.
Abbreviations: Δt50%up, duration to 50% redilation of cutaneous vessels; HRV, heart rate variability; ns, not significant.