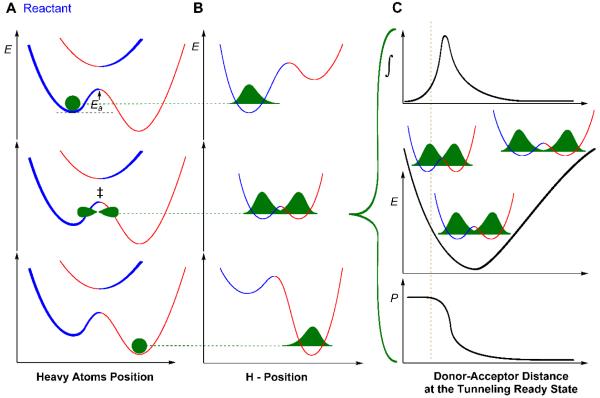
Figure 1.
Graphical representation of the phenomenological model for an electronically adiabatic H-transfer reaction. This figure illustrates Eq. 1 with blue and red wells representing the reactant and the product states, respectively. Panel A represents the heavy atom coordinate with the electronic ground-state potential and the first electronic-excited-state at the reactant (top), TRS (middle) and the product (bottom) state, with the green structures representing the position of transferring hydrogen. Panel B shows an orthogonal view to the panel A, showing the coordinates for H-transfer. In top row of A and B, the heavy atom position and the hydrogen wave function are localized in the reactant well. In the middle row of A and B, the ZPEs of donor and acceptor are degenerate and the tunneling probability is non-zero (TRS), so the H-wave function can tunnel through the barrier, or be transferred over the barrier if the DAD is short enough for the ZPEs to be above the barrier. Further reorganization of the heavy atom breaks the degeneracy, trapping the transferred hydrogen in the product well. Panel C illustrates the transmission probability P as function of DAD (bottom panel; first term in the integral of Eq. 1), the potential energy surface along the DAD coordinate (middle panel; second term in the integral of Eq. 1) with different level of overlaps between the reactant and the product wave functions at different DADs. The contribution to the H-transfer at each DAD as a function of the P and population is shown in the top panel (the product of both terms in the integral as function of DAD). The vertical line separates the shorter DADs where the zero point energy (ZPE) of the transferred H is above the energy barrier (over the barrier transfer) from the tunneling conformations.

