Figure 4.
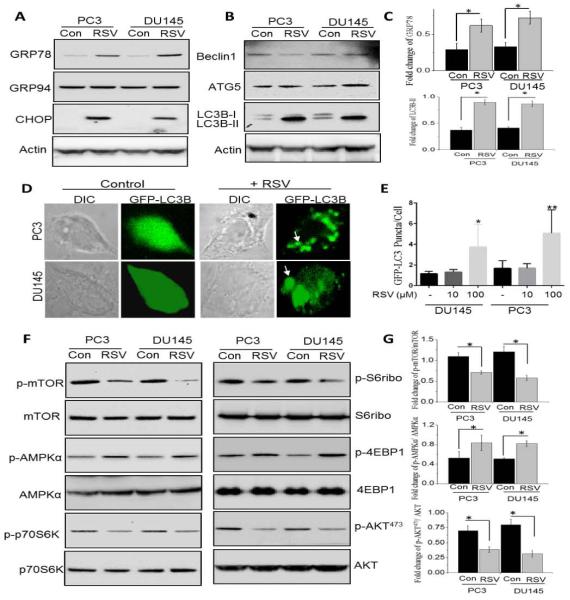
RSV treatment in prostate cancer cells induces ER stress and autophagy via inhibiting the mTOR/AKT pathway: (A) Western blot images showing the expression of unfolded protein response (UPR) markers (GRP78, GRP94, and CHOP) in the prostate cancer cells after 100μM RSV treatment for 24 hours. (B) Western blot images showing the expression of autophagy protein markers Beclin1, ATG5, LC3B in control and RSV treated cells. (C) Histogram represents the relative intensity of GRP78 and LC3B normalized to β-actin. Values represent mean ± SEM from 3-4 independent experiments (*P < 0.05). (D & E) GFP-LC3 expressing PC3 and DU145 cells were treated with RSV for 24h. Quantitation shown on the right represents mean ± SEM. GFP-positive puncta per cell from three independent experiments (*P < 0.05 and ** P<0.01). (F) Western blot images showing the phosphorylation of mTOR, AMPKα, p70S6K, S6ribo, 4EBP1 and AKT (Cell Signaling Technology, MA.) in both PC3 and DU145 cells after 100μM RSV treatment for 24 hours. (G) Histogram represents the relative intensity of phospho-mTOR, phospho-AMPKα and phospho-AKT normalized to their respective total proteins. Values represent mean ± SEM from 3-4 independent experiments (*P < 0.05).

