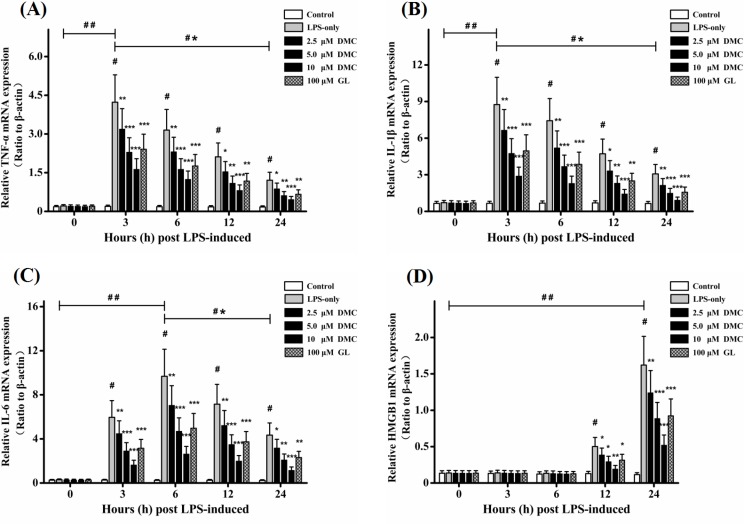
Fig. 2.
Effects of DMC on the expressions of TNF-α, IL-1β, IL-6, and HMGB1 mRNA in LPS-induced RAW 264.7 cells. Levels of TNF-α (A), IL-1β (B), IL-6 (C), and HMGB1 (D) mRNA expressions were measured by RT-PCR. Treatment with Glycyrrhizin (GL, 100 μM) acted as positive control group. β-actin acted as loading control. The bar graph showing semi-quantitative densitometric analysis summarizes the fold change of TNF-α, IL-1β, IL-6, and HMGB1 expressions in each group. Each value represents the mean ± SD of triplicate experiments. #p<0.001 as compared with control group. *p<0.05, **p<0.01 and ***p<0.001 as compared with LPS-induced group only. ##p<0.001 as the maximum value compared with control group. *#p<0.001 as the maximum value compared with the value at 24 h.

