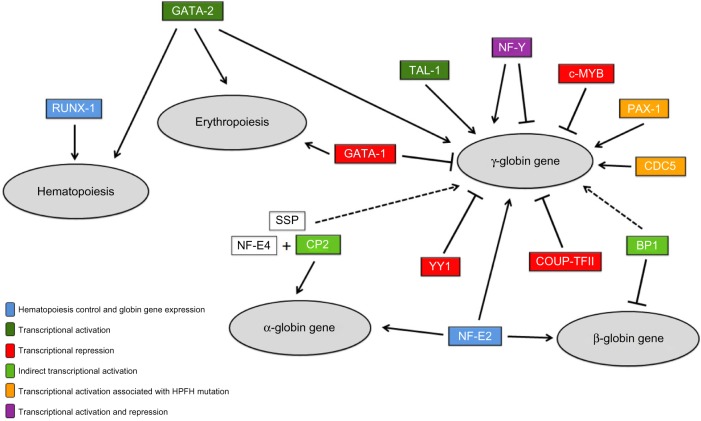
Figure 2.
Representation of the interaction between transcription factors and regulation of hematopoiesis, erythropoiesis, and the globin genes. The 13 transcription factors selected from in silico analysis are showed. The continuous arrows indicate elements that act as transcriptional activators. The dashed arrows indicate indirect activators. The bars show transcriptional repressors. Boxes without staining (NF-E4 and SSP) indicate factors that comprise protein complexes involved in globin regulation. The different colors of transcription factors represent different forms of action: dark green represents direct transcriptional activation, orange transcriptional activation mediated by the presence of specific mutations, light green indirect transcriptional activation, red transcriptional repression, and blue control of hematopoiesis and erythropoiesis and synthesis of globin chains. We used the Microsoft PowerPoint to elaborate this figure.

