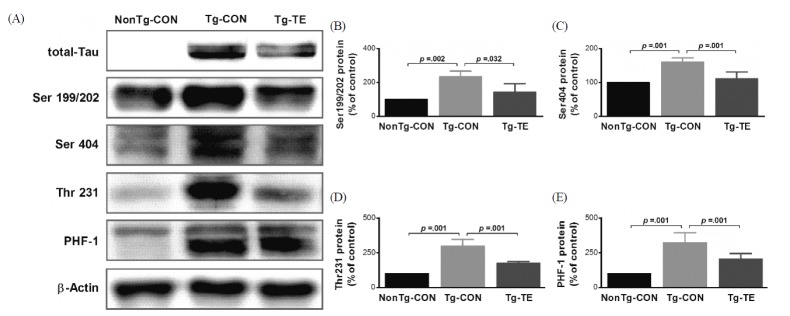
Fig. 4.

The effects of TE on expression of p-Tau proteins in the cerebral cortex of NSE/htau23 mice. (A) Representative western blots of p-Tau proteins, (B–E) Densitiometric analysis of the Western blot bands normalized to β-Actin. The data shown in the western blot were means from seven mice brains. β-Actin were probed as an internal control. Bonferroni post hoc test after ANOVA. Values are presented as means ± SD.
