
Fig. 1.
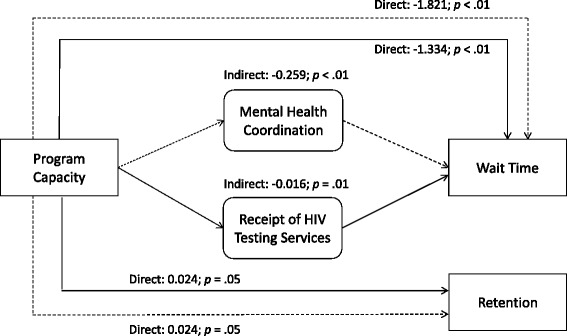
Program capacity, service coordination, and wait time and retention among minorities. Note: Only significant indirect paths are reported. P-values represent bootstrap p-values. Dotted lines represent estimates including mental health coordination indirect path; solid lines represent path estimates including receipt of HIV testing services indirect path. White is the reference category for race and ethnicity; low program capacity is the reference category for high program capacity. The analytic sample is N = 13,478. We adjusted for program-level variables (private insurance, organizational cultural competence, and public funding) and client-level variables (gender, mental illness, homelessness, Medi-Cal eligibility, referral type, race, treatment type)