Fig. 3.

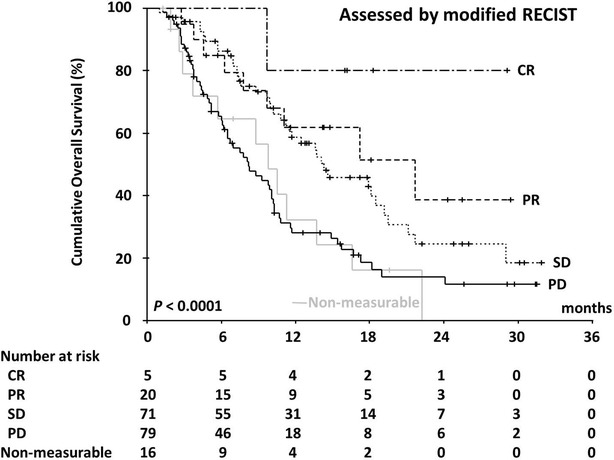
Kaplan–Meier analysis of overall survival. The log-rank test showed significant differences between the four groups (P < 0.0001) categorized according to mRECIST

Kaplan–Meier analysis of overall survival. The log-rank test showed significant differences between the four groups (P < 0.0001) categorized according to mRECIST