Fig. 4.

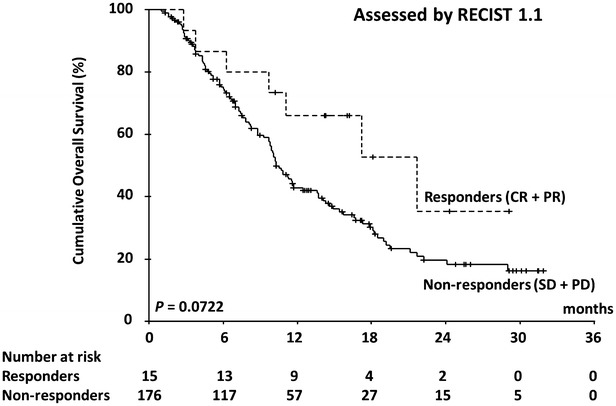
Kaplan–Meier analysis of overall survival. The log-rank test did not show significant differences between responders and non-responders classified according to RECIST 1.1 (P = 0.0722)

Kaplan–Meier analysis of overall survival. The log-rank test did not show significant differences between responders and non-responders classified according to RECIST 1.1 (P = 0.0722)