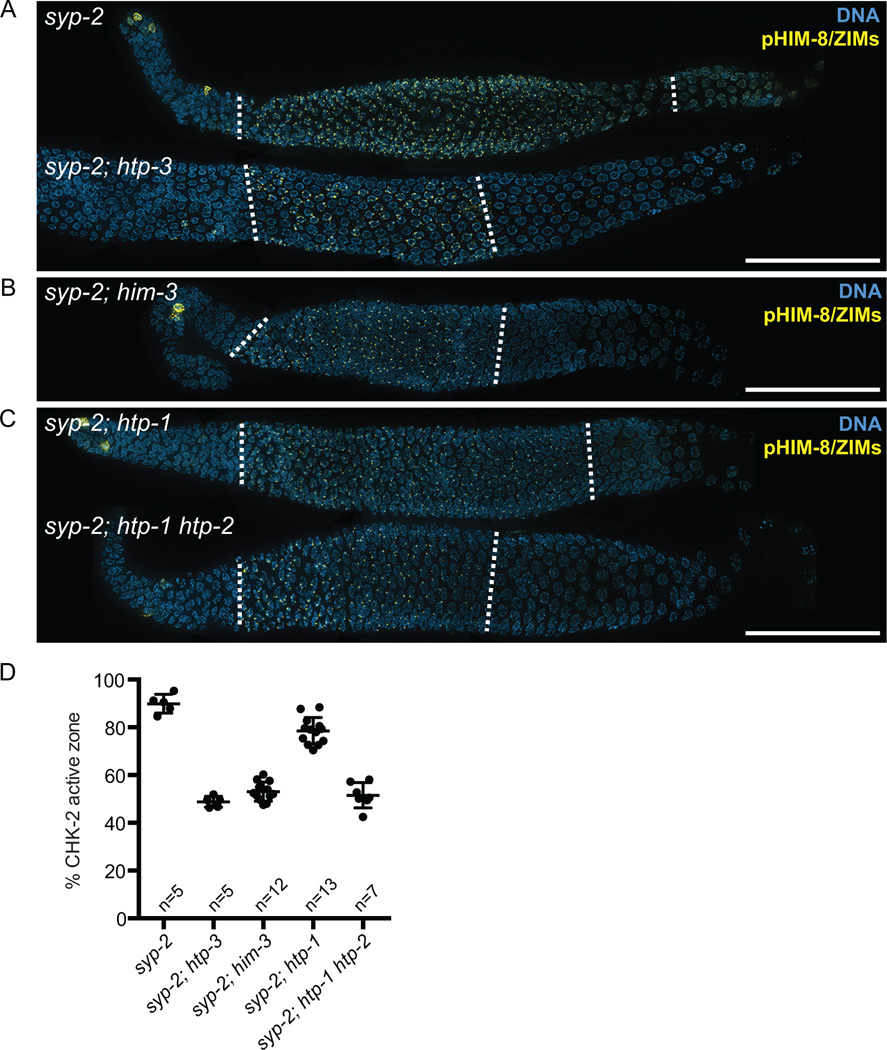
Figure 4. Deleting meiotic HORMA domain proteins suppresses the extension of CHK-2 activity in syp-2 mutants.
(A–C) Immunofluorescence images of dissected gonads from syp-2, syp-2; htp-3, syp-2; him-3, syp-2; htp-1, and syp-2; htp-1 htp-2 mutants stained with anti-pHIM-8/ZIMs (yellow) and DAPI (blue). The CHK-2 active zone is marked by dotted white lines. Scale bars, 50 µm (D) Graph showing quantification of the CHK-2 active zone in the indicated strains. Numbers of gonads scored are indicated below. syp-2 and syp-2; htp-1 mutants showed significant differences from N2 (p<0.0001), whereas syp-2; htp-3 (p=0.9926), syp-2; him-3 (p=0.0138), and syp-2; htp-1 htp- 2 (p=0.2439) did not, by ordinary one-way ANOVA.

