
Fig. 1. Ankyrin-G/βII-spectrin microdomains sample the entire lateral membrane through microtubule-dependent localized movement.
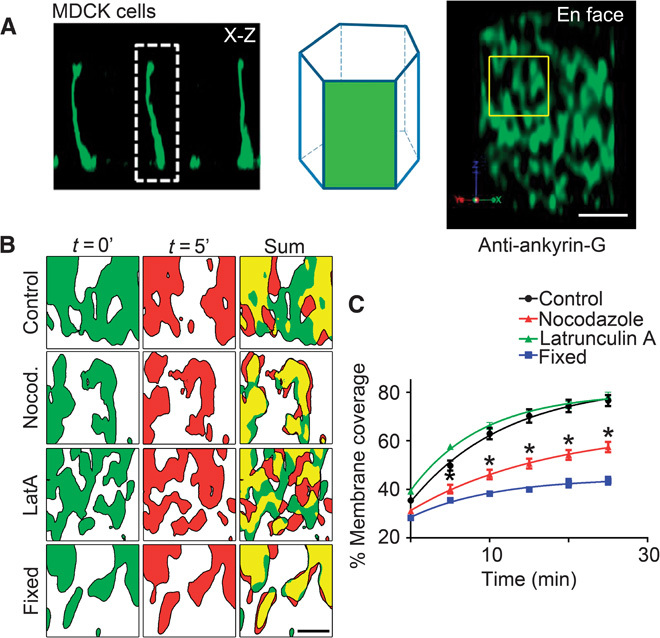
(A) Schematic depicting the en face visualization of the columnar epithelial cell lateral membrane. Representative deconvolved en face (right) image from MDCK cells stained with antibodies against endogenous ankyrin-G. Scale bar, 2.5 μm. Region of interest depicts size of area analyzed in (B). (B) Representative deconvolved en face confocal images of live MDCK cells transfected with ankyrin-G–GFP shown at time 0 (green) or 5 min (red) for control cells (top) or cells treated for 3 hours with nocodazole (Nocod.) (100 ng/ml) (second row) or 1 μM latrunculin A (LatA) (third row). Cells fixed with paraformaldehyde (bottom) were used as an imaging control. Summed coverage at 0 and 5 min shown on the right. Scale bar, 1 μm. (C) Quantification of percent lateral membrane coverage from cells in (B). One-way analysis of variance (ANOVA) followed by Tukey post hoc test; *P < 0.05 compared to control, n = 4 to 9 cells per condition.