
Figure 2.
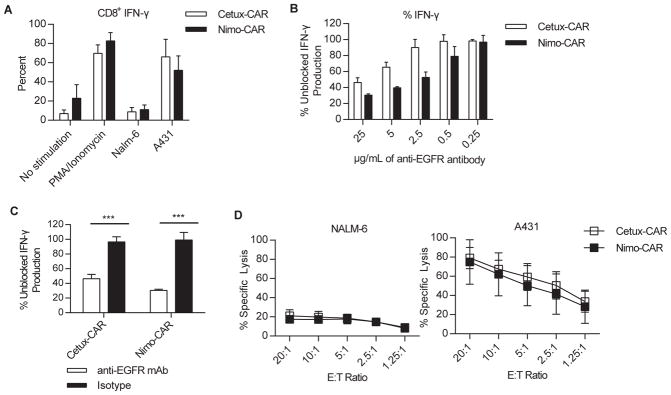
Cetux-CAR+ and Nimo-CAR+ T cells are activated in response to EGFR. (A) Production of IFN-γ by CD8+CAR+ T cells in response to co-culture with A431 and NALM-6 cell lines measured by intracellular flow cytometry gated on CD8+ cells. Data represented as mean ± SD, n=4,*** p < 0.001, two-way ANOVA (Sidak’s post-test). (B) Production of IFN-γ in response to EGFR+ A431 in the presence of titrating concentrations of EGFR-blocking mAb (clone LA1, Millipore). CAR+ T cells were co-cultured with A431 with EGFR-specific mAb and IFN-γ production was measured by intracellular flow cytometry. Percent of production was calculated as MFI of IFN-γ in gated CD8+ T cells relative to unblocked CD8+ T-cell production. Data represented as mean ± SD, n=3. (C) Production of IFN-γ as measured by intracellular flow cytometry in response to EGFR+ A431 in the presence 25 μg/mL of EGFR-blocking mAb (clone LA1, Millipore). Percent of production was calculated as MFI of IFN-γ in gated CD8+ T cells relative to unblocked CD8+ T-cell production. Data represented as mean ± SD, n=3, *** p<0.001, two-way ANOVA (Sidak’s post-test). (D) Specific lysis of A431 and NALM-6 by CAR+ T cells measured by standard 4 hour chromium release assay. Data represented as mean ± SD, n=4.