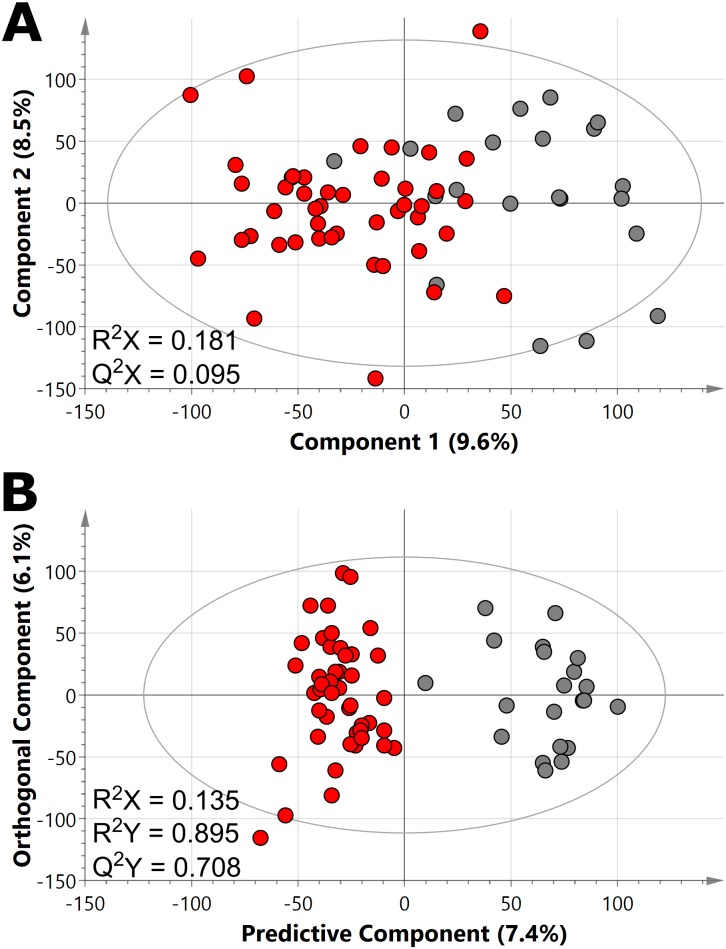
Fig 1. Plasma in HAT patients display different 1H NMR metabolic profiles compared with controls.
PCA model (A) and O-PLS-DA model (B) score plots of plasma 1H NMR spectra across HAT patients and controls. Each circle represents a spectra from one sample, whereby patients are presented in red (n = 45) and controls in dark grey (n = 21). Abbreviations: R2X, model fit parameter for variation in spectral data; R2Y, model fit parameter for variation in classifier data (for O-PLS-DA); Q2, model predictive parameter for spectral data in PCA (Q2X) and for classifier data in O-PLS-DA (Q2Y). Individual component contribution of R2X are shown on the axes as percentage.

