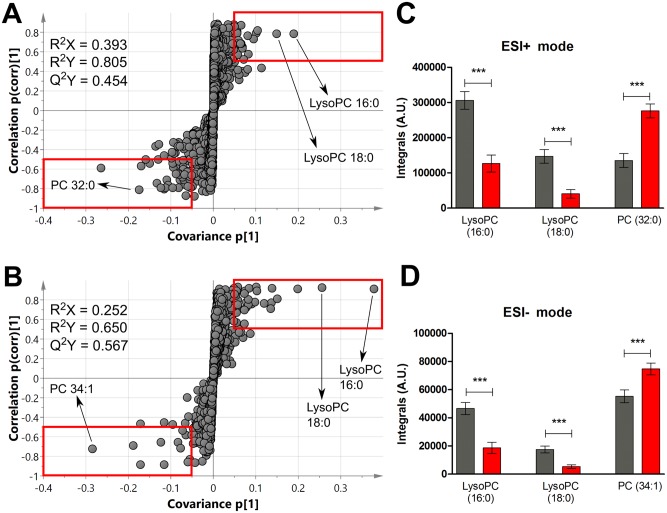
Fig 3. Plasma in HAT patients display different lipid profiles compared with controls.
S-plots of O-PLS-DA model for plasma lipid profiling UPLC-MS features detected in ESI+ mode (A) and ESI- mode (B), whereby each circle represents one feature with a unique combination of m/z and retention time values. Discriminatory features selected surpassed p[1] and p(corr)[1] threshold criteria, highlighted in red boxes (see Methods). See S1 Fig for corresponding scores plots. Integrals of features highlighted in the S-plots are shown as bar-chart showing mean averages ± standard error of the mean, for both ESI+ (C) and ESI- (D). Patients levels are shown in red (n = 16) and controls in dark grey (n = 14). Significant differences, as measured via Welch T-test with multiple test correction, are labelled with asterisks, where *** p<0.001. Abbreviations: A.U., arbitrary units; LysoPC, lysophosphatidylcholine; PC, phosphatidylcholine.

