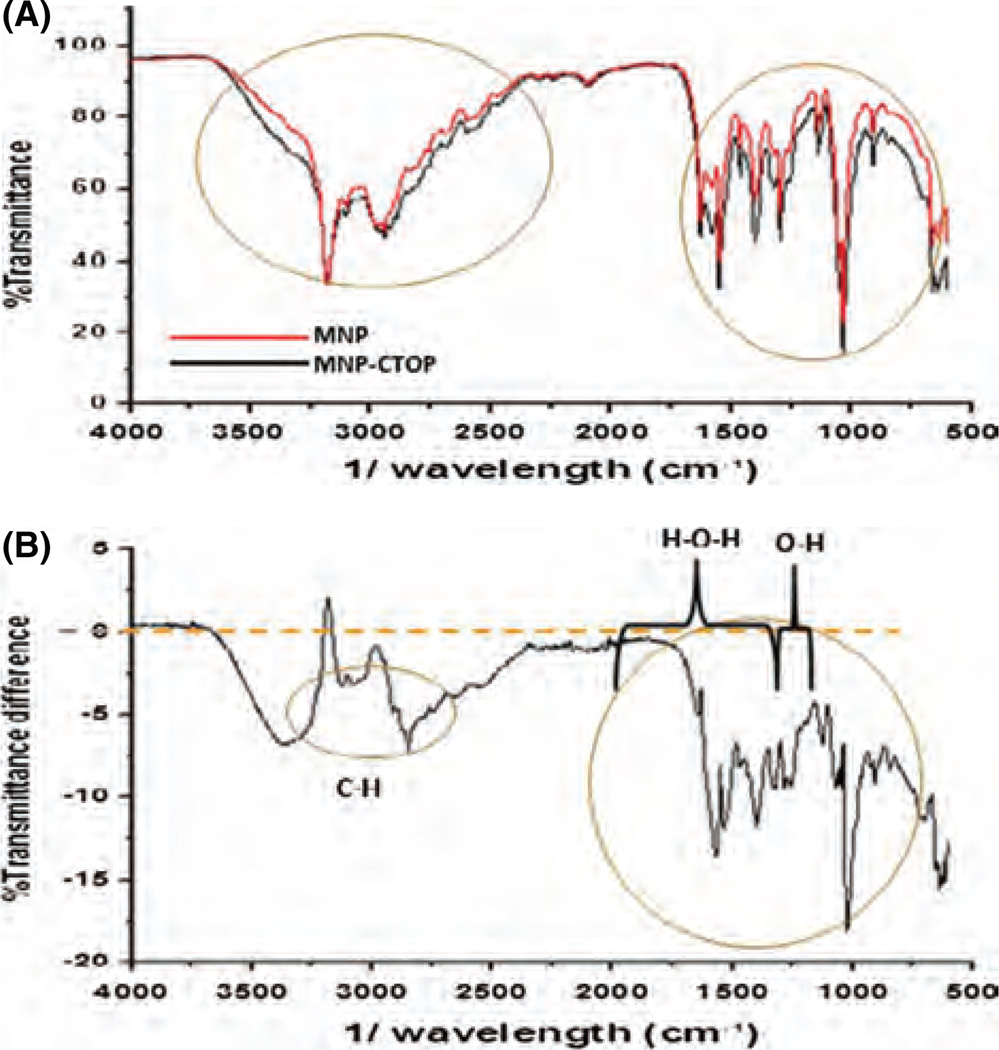
Figure 3.
FTIR spectra of transmittance: (A) % transmittance of MNP and “MNP + CTOP.” (B) Difference between % transmittance of MNP and “MNP+CTOP”: transmittance of “MNP+ CTOP” obtained from FTIR were subtracted from transmittance of MNP and difference in transmittance at specific band ranges were co-related with presence or absence of functional group associated with CTOP and aqueous medium.

