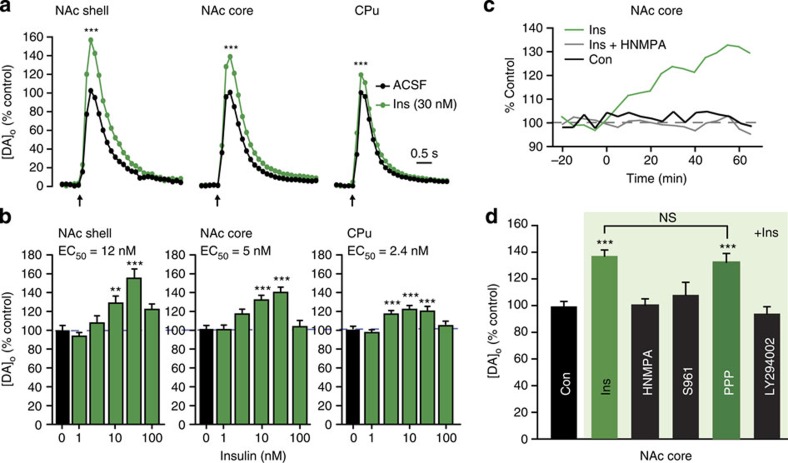
Figure 1. Insulin-dependent increases in evoked [DA]o require InsRs and PI3K.
(a) Average single-pulse-evoked [DA]o in NAc shell, NAc core and CPu before and after insulin (Ins) illustrated for 30 nM; error bars omitted, but see (b); arrows indicate time of stimulus. Insulin increased evoked [DA]o in shell (by 55±10%), core (by 37±5%) and CPu (by 20±4%) (***P<0.001). (b) Effect of insulin was concentration dependent across a physiological range (1–30 nM) in shell (n=22–24, F5,133=14.471, P<0.001), core (n=36–76, F5,308=16.318, P<0.001) and CPu (n=30–62, F5,253=13.763, P<0.001), but lost at ≥100 nM. (c) Representative recordings of peak-evoked [DA]o versus time at a single site in the NAc core in the absence of drug application (Con), during application of insulin (30 nM) or when insulin was applied in the presence of an InsR inhibitor HNMPA (5 μM). (d) Average peak-evoked [DA]o data showing prevention of the effect of insulin (30 nM) by HNMPA, InsR antagonist S961 (1 μM) and PI3K inhibitor LY294002 (1 μM), but not by IGF-1R inhibitor PPP (1 μM) (n=29–76; P>0.9 versus insulin alone). For Fig. 1a–d, n=number of sites per subregion from 3–6 rats for each drug or insulin concentration; one-way ANOVA, Tukey honest significance test (HSD). See Supplementary Fig. 1b,c for NAc shell and CPu data.

