
Fig. 5.
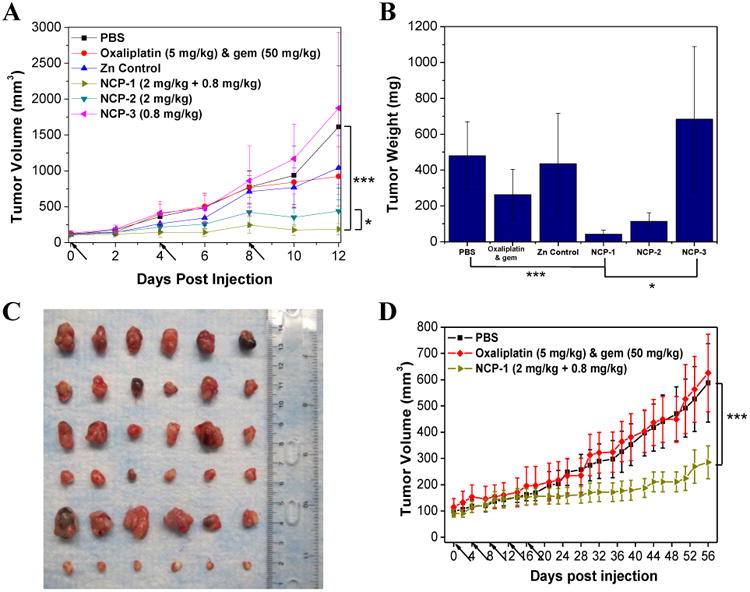
(A) In vivo tumor growth inhibition curves for PBS(■), oxaliplatin & gem (◆), Zn Control (▲), NCP-1(►), NCP-2 (▼), and NCP-3 (◄) on subcutaneous BxPc-3 xenografts. Oxaliplatin (dose, 5 mg/kg) and gem (dose, 50 mg/kg), NCP-1 (doses, 2 mg/kg + 0.8 mg/kg), NCP-2 (dose, 2 mg/kg), and NCP-3 (dose, 0.8 mg/kg) were administered on day 0, 4, and 8. Data are expressed as means±S.D. (n=6), *p<0.05, **p<0.01, ***p<0.001. (B) End-point tumor weights. Data are expressed as means±S.D. (n=6), *p<0.05, **p<0.01, ***p<0.001. (C) Photos of the resected BxPc-3 tumors from top to bottom: PBS, oxaliplatin & gem, Zn Control, NCP-2, NCP-3, and NCP-1. (D) In vivo tumor growth inhibition curves for PBS(■),oxaliplatin & gem (◆), and NCP-1(►) on subcutaneous AsPc-1 xenografts. Oxaliplatin (dose, 5 mg/kg) and gem (dose, 50 mg/kg) and NCP-1 (doses, 2 mg/kg + 0.8 mg/kg) were administered on day 0, 4, 8, 12, 16, and 20. Data are expressed as means±S.D. (n=6), *p<0.05, **p<0.01, ***p<0.001.