
Figure 2. Transcription initiation in hindering-load assay.
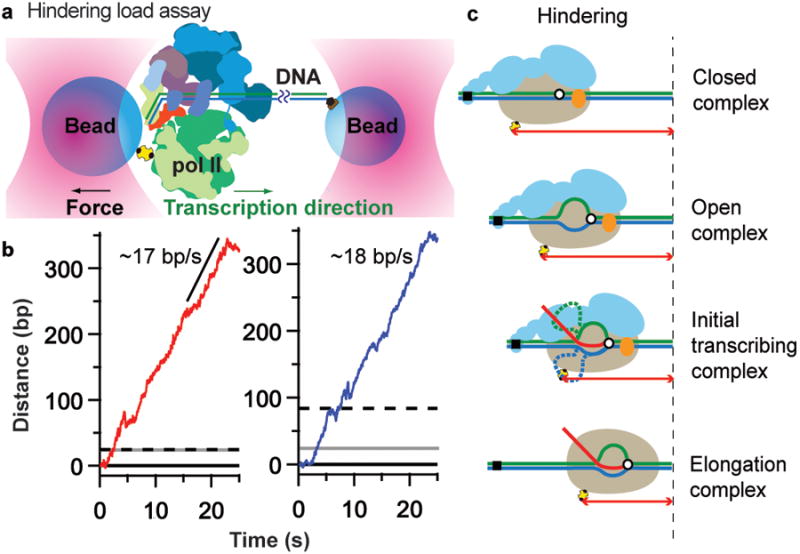
(a) By attaching one bead to downstream DNA, a hindering-load assay was developed (not to scale, Sub1 not shown). Scanning and subsequent transcription events (green arrow indicates transcription direction) resulted in tether-extension decrease. (b) Records illustrating pol II escape and elongation, with a velocity of ∼17–18 bp/s, collected on SNR20* short (red, left panel) and SNR20* long (blue, right panel) in the presence of rNTPs. The dashed black line denotes the TSS at +1; the solid grey line marks position of the predicted ∼24 bp distance change upon OC formation. (c) Distances measured by the assays are indicated (color scheme same as Fig. 1c).