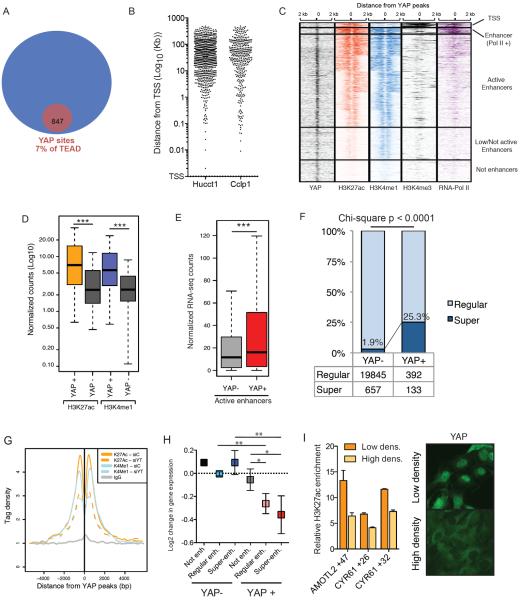
Figure 1. YAP binds to potent enhancers.
A) Venn diagram of the common TEAD1/4 and YAP peaks in HuCCT1 cells. B) Scatter plot of the distance distribution of YAP peaks from the closest TSS in the indicated cell lines. C) Heatmap for the ChIP-seq signal of the indicated antibodies +/−2Kb from the center of YAP peaks. Clustering results from K-means method. D) Box plots of the normalized counts of H3K27ac and H3K4me1 signal at YAP+ enhancer peaks or YAP− enhancers. *** p<0.0001. E) Boxplot indicating expression levels of genes associated to YAP+ or YAP− enhancers following RNAseq in HUCCT1 cells. F) Histogram indicating the fraction of YAP− or YAP+ enhancers catalogued as regular o super- enhancers in HuCCT1 cells. G) Line plots depicting H3K27Ac and H3K3me1 average signal in YAP+ enhancers upon siYT treatment. H) Log2 changes in gene expression between siControl / siYT treated cells for genes associated with different genomic elements 48h post transfection. Error bars represent 95% CI. I) Left panel, ChIP-qPCR for H3K27ac in selected YREs in cells at low and high density. Error bars = SD. Right panel, immunofluorescence for YAP in these conditions. See also Figure S1.

