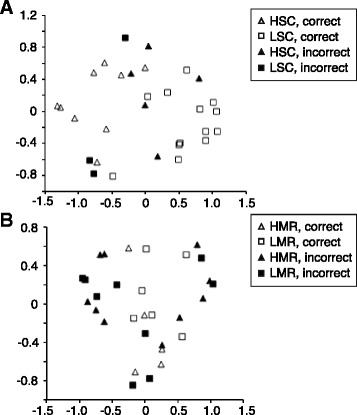
Fig. 6.

Multidimensional scaling (MDS) plots illustrating seminal fluid compositional differences under variable sperm competition risk and potential mating rate. MDS plots showing the distance between samples in two dimensions, MDS1 (x) and MDS2 (y). Plots are produced from the proximity matrix generated in Random Forest (RF) models that were used to classify samples according to (a) the number of males and (b) number of females to which each male was exposed. Square symbols are individuals that were exposed to the “low” treatment, i.e. either one male (in a) or two females (in b). Triangular symbols are individuals exposed to the “high” treatment in each analysis, i.e. either three males (in a) or four females (in b). Filled symbols indicate samples that were incorrectly predicted by the RF model, illustrating the much better ability of the RF analysis to classify samples correctly based on cues of likely sperm competition (a; 22/30 classified correctly) rather than cues of potential mating opportunities (b; 11/30 classified correctly; see main text for test statistics). HSC: high sperm competition; LSC: low sperm competition; HMR: high mating rate; LMR: low mating rate.
