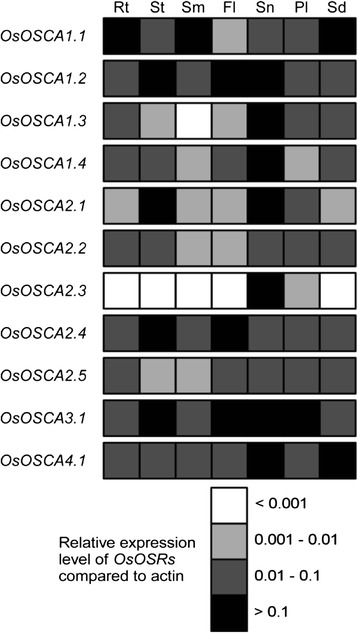
Fig. 3.

Schematic representation of organ-specific expression of the OsOSCA genes. The expression levels of 11 OsOSCAs were monitored using qRT-PCR. The values were normalised to the control gene (actin) and represented using a colour scale to facilitate visualisation. The letters at the top indicate the selected tissues and organs: 30-day-old root (Rt), 30-day-old shoot (St), mature stem (St), mature flag leaf (Fl), stamen (Sn), pistil (Pi), and mature seed (Sd). The colours white, light grey, dark grey, and black represent the multiple ranges of OsOSCAs mRNA expression levels, which were <0.001, 0.001–0.01, 0.01–0.1, and >0.1 compared with actin, respectively. The values represent the average of three independent biological replicates
