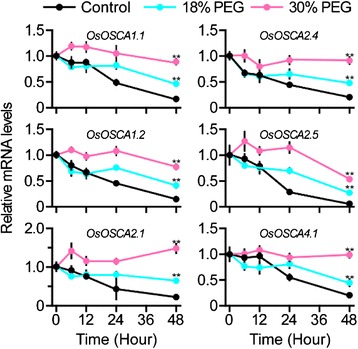
Fig. 5.

Expression analysis of OsOSCAs during PEG-treated seed imbibition. The expression levels of 11 OsOSCAs were monitored using qRT-PCR. The PEG concentration (m/v) values are represented using the colour scale shown at the top. Samples were collected after 0, 1, 6, 12, 24, 48, and 72 h of treatment with the corresponding concentration of PEG (shown on the bottom). Water content in the samples is shown in Additional file 7: Figure S3. The relative mRNA levels of individual genes were normalised to that of rice actin. Error bars indicate the SD of three biological replicates. The star indicates statistically significant differences (p < 0.05) according to Tukey’s multiple range test
