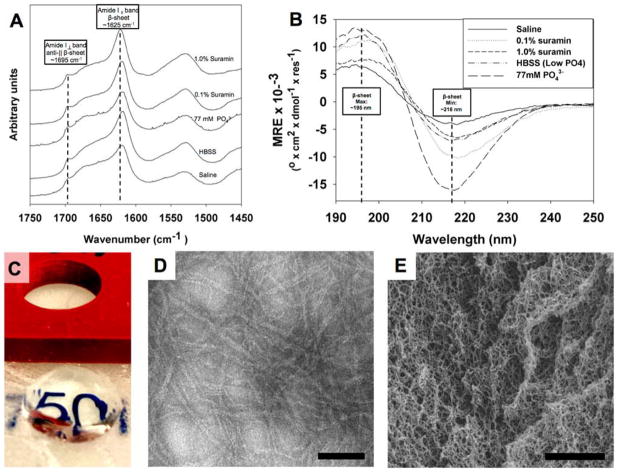
Figure 4.
Characterization of peptide structure. (A) FTIR spectroscopy showing characteristic peaks for the formation of a β-sheet structure when peptide is mixed with saline, HBSS, high-ionic-strength phosphate, and two different suramin concentrations. (B) CD spectroscopy confirmed formation of β-sheet structure. Note that gels formed aggregates, resulting in lower minima/maxima intensity for higher concentration of suramin. For FTIR and CD, all samples were identically diluted as detailed in the Experimental Methods. (C) Peptide–drug mixtures cast in cylindrical molds create optically transparent gels that maintain their structure. (D) Peptide hydrogels with drug loading create nanofiber matrix seen in negative-stain TEM, scale bar = 50 nm. (E) SEM of dehydrated hydrogel, scale bar = 1 μm.

