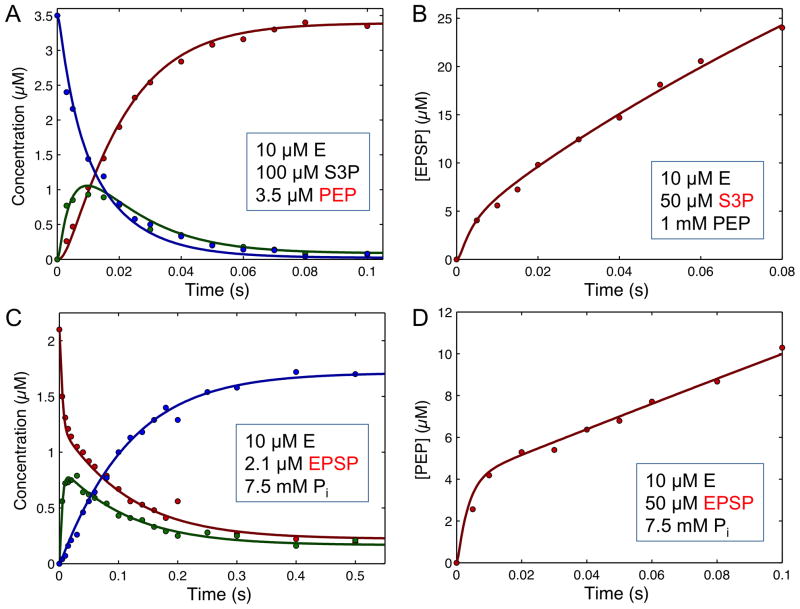
Figure 7. EPSP presteady-state and single turnover kinetics.
A. Single turnover in the forward direction. B. Presteady state burst in the forward direction. C. Single turnover of the reaction in the reverse direction. D. Presteady state burst in the reverse direction. The inset to each figure gives the starting concentration of reach reactant, and the species shown in red contains the radiolabel. Redrawn with permission from (34). The smooth lines were calculated by simulation according to the pathway and rate constants given in Scheme 3. Data and simulations are available in the “EPSP.mec” KinTek Explorer example file.

