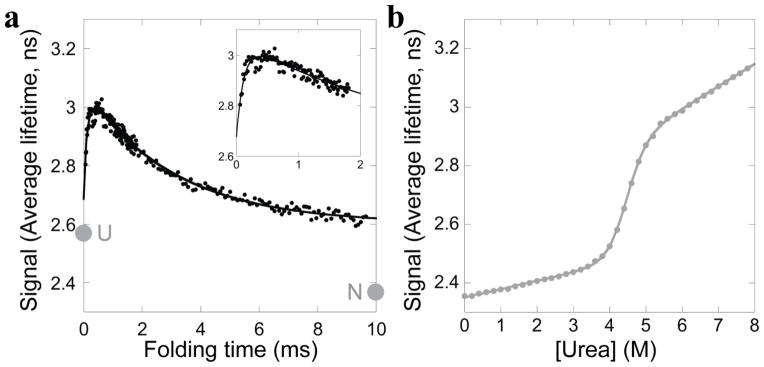
Figure 2.

Wild type E. coli RNase H. a. Refolding into 0.6 M urea monitored by average fluorescence lifetime. For comparison, the extrapolated signal of the unfolded state (U) and the signal of the final equilibrium state (N) at this condition are indicated. Inset: Refolding monitored in just the fastest mixing device. b. Equilibrium urea denaturation monitored by average fluorescent lifetime. Data are fit with a two-state model.
