Figure 2.
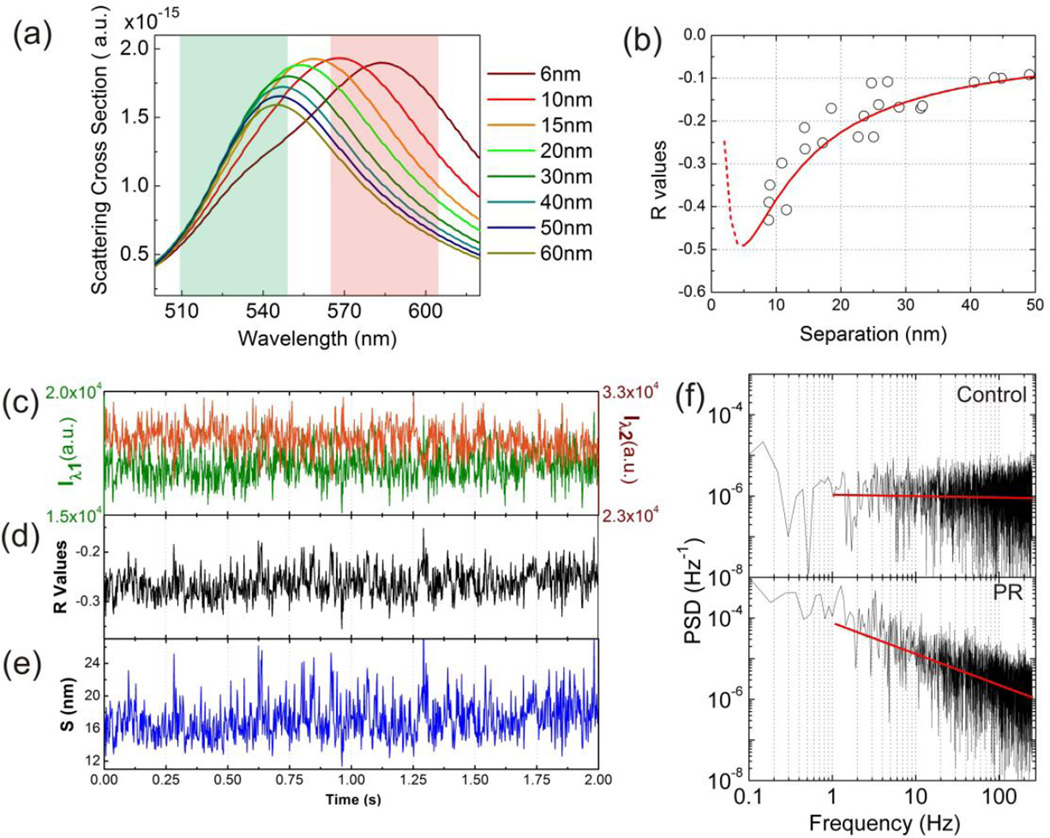
(a) FDTD simulated scattering cross-sections of dimers with various interparticle separations. The green and red colored areas represent the spectral ranges of the bandpass filters of the two monitored color channels. (b) R(S) calibration generated from FDTD simulations (red line) and experimental validation data (black circle). (c) Scattering intensity trajectory of a representative PR2 recorded with a frame rate of 490 fps simultaneously on the Iλ1 (green) and Iλ2 (red) channel. (d) and (e) show the corresponding R and S trajectories. (f) Power spectral density (PSD) of the R-trajectory shown in (d) (bottom) and an individual 80 nm diameter gold NP (top) for comparison. The linear decay of the PSD for the PR in the log-log plot confirms a power law dependence. The constant PSD for the individual gold NP is characteristic of a random (white) noise process.

