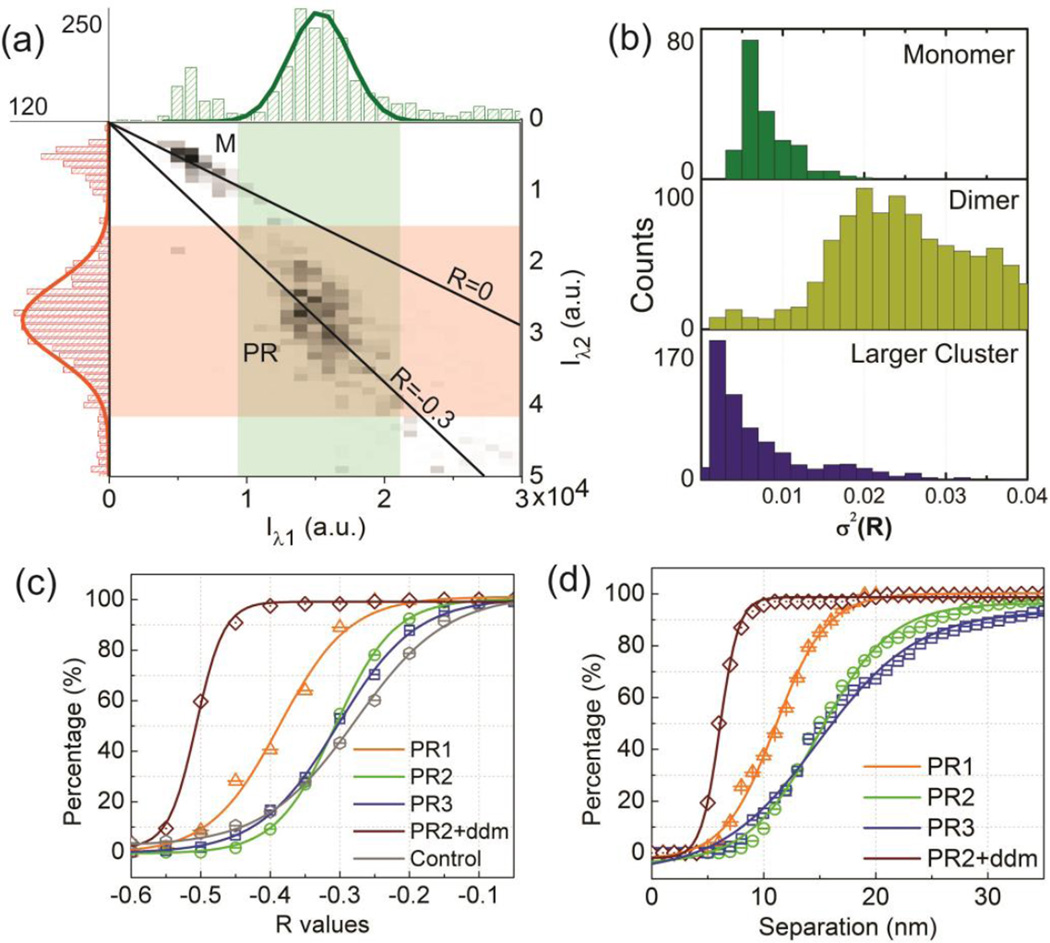
Figure 3.
(a) Average intensity distribution in the 530 channel (green) and 585 channel (red) for individual scatterers diffusing on the lipid membrane after PR binding. The intensities cluster in two distinct groups, which are assigned to NP monomers (M) and PRs. Signals in the high intensity tail of the distribution are assigned to larger clusters. (b) Distribution of spectral variance, measured as σ2(R), for monomers, dimers and larger clusters diffusing on the membrane with a linear polarizer in the detection beam path. The significant higher variance for dimers is consistent with the anisotropic shape of the PRs. If the long axes aligns with the analyzer axis, the intensity is much higher than for the orthogonal orientation. (c) and (d) Cumulative distribution plots of R̄ (c) and S̄ (d) for PR1-3, the dendrimer compacted PR2 and 80nm gold NPs.

