
Figure 4.
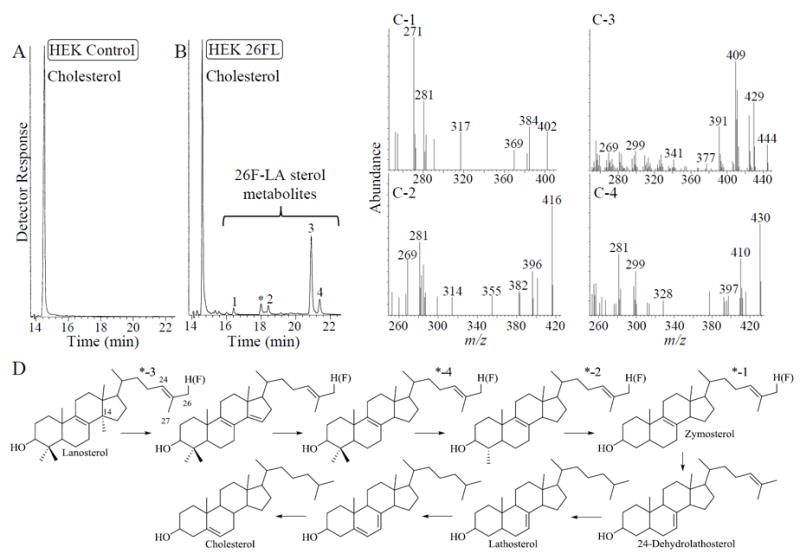
GC-MS analysis of neutral lipids from 26-fluorolanosterol-treated HEK cells. Panel A is total ion chromatogram of HEK control while Panel B is total ion chromatogram of 26-fluorolanosterol-treated cells. Panel C shows the mass spectra for the four 26-fluorosterols detected in the chromatogram and labeled in peaks 1 to 4; peak with star is a non-steroidal compound. Panel D shows the conical pathway for conversion of lanosterol to cholesterol with starred compounds corresponding to 26-fluorosterol metabolites shown in Panel B.