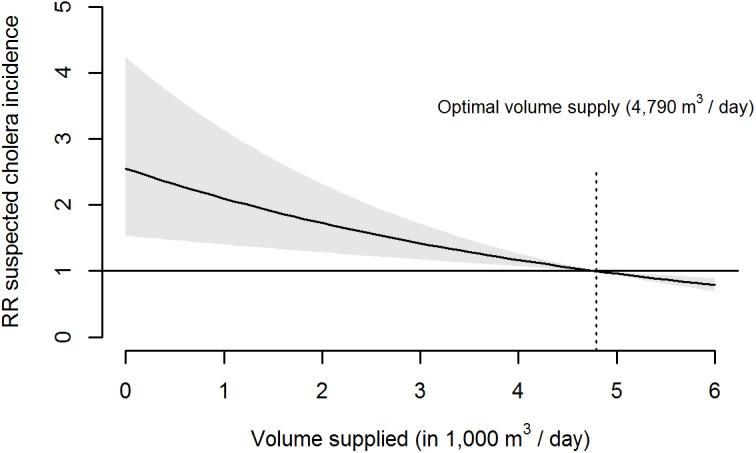
Fig 3. Twelve-day cumulative association of volume of tap water supplied with suspected cholera incidence in Uvira.

Shaded area: 95% CI for relative risk (RR)–model predictors: daily volume of water supplied, cubic spline of date, day of the week, precipitation rate of the day and number of CTC admissions on the previous 12 d.
