Figure 1.
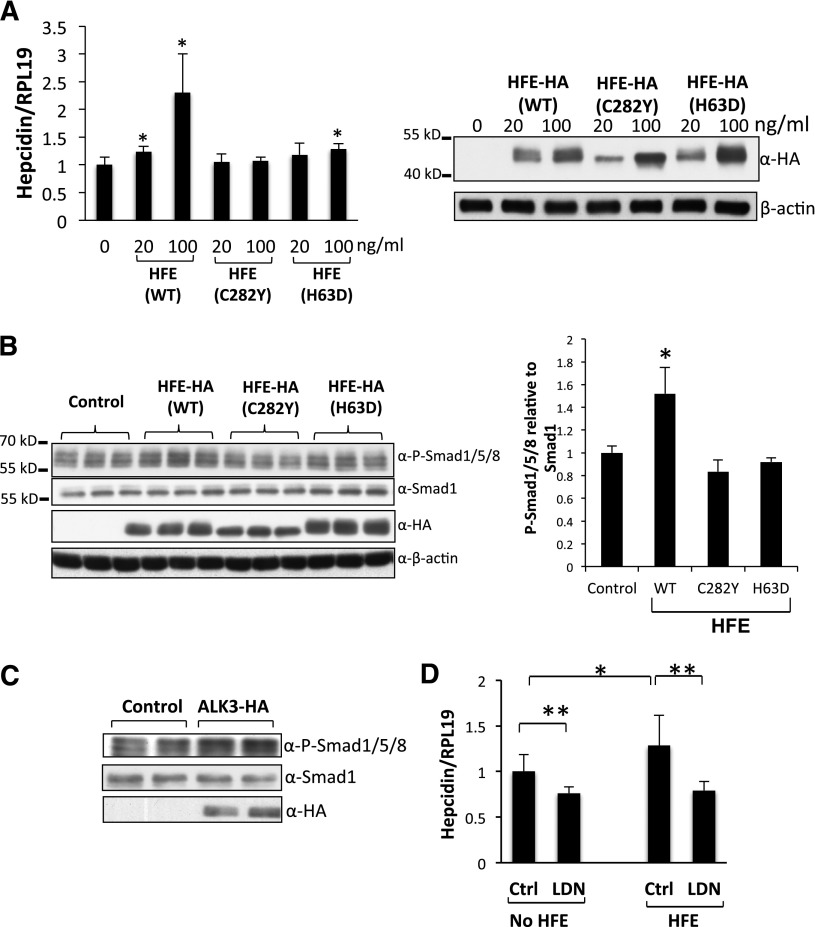
HFE increases hepcidin expression through the BMP pathway. (A) Hep3B cells were transfected with WT, HFE-C282Y, or HFE-H63D at 0, 20, and 100 ng/mL. Forty-eight hours after transfection, cells were harvested for real-time PCR analysis for hepcidin mRNA levels, and for western blotting for HFE protein levels. (B) Hep3B cells were transfected with WT, HFE (C282Y), or HFE (H63D) at 100 ng/mL. Cells were harvested for western blotting for phospho-Smad1/5/8, Smad1, and HFE expression (right panel). Phospho-Smad1/5/8 levels obtained by western blot analysis were quantified and normalized to the signal obtained for Smad1 (left panel). (C) Hep3B cells were transfected with empty vector (control) or ALK3-HA expression plasmid. Cells were harvested for western blot analysis for phospho-Smad1/5/8, Smad1, and ALK3 protein expression. (D) Hep3B cells were transfected with or without HFE-Myc (100 ng/mL). Forty-two hours after transfection, cells were treated with or without LDN-193189 (20 nM) for 6 hours. Cells were then collected for real-time PCR analysis for hepcidin and RPL19 mRNA levels. Data represent averages of the values from 3 separate experiments. RPL19 is the internal control. β-actin is the loading control in western blotting. *P < .05, **P < .01 vs the control (bar 1). Data are represented as mean ± SD (n = 3).

