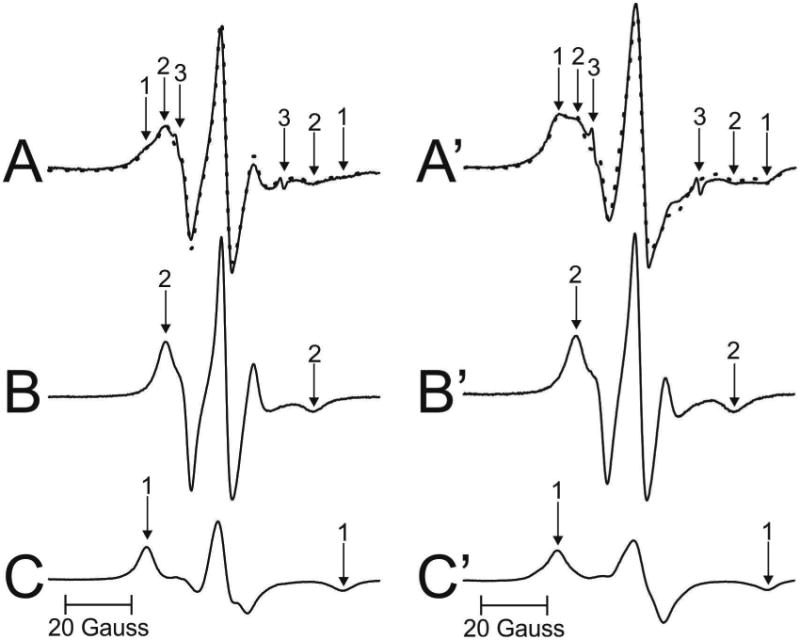
Fig. 3.

Representative EPR spectra of 12-SASL from cortical (A – solid line) and nuclear (A′ - solid line) porcine intact membranes Spectra were recorded at 37 °C. Arrows 1–3 represent spectra from strongly immobilized, weakly immobilized, and water components, respectively. See also Fig. 2 for the distribution of 12-SASL between lipid domains in intact membranes. The procedures for the evaluation of the relative amounts of PLs in domains in the lipid bilayer portions of cortical and nuclear intact membrane are also illustrated. The EPR spectra of 12-SASL in cortical (B) and nuclear (B′) lens lipid membranes obtained at 34 °C and 28 °C simulate, res pectively, the weekly immobilized components in spectra A and A′ (coming from 12-SASL located in bulk lipids). The spectra of 12-SASL in cortical (C) and nuclear (C′) lens lipid membranes obtained at −13 °C and −58 °C simulate, respectively, the strong ly immobilized component in spectra A and A′ (coming from 12-SASL located in boundary and trapped lipids). These spectra have the same maximum splitting as the weakly and the strongly immobilized component in spectra A and A′. The dotted spectrum in A (and A′) was obtained by adding 64% of spectrum B (31% of spectrum B′) and 36% of spectrum C (69% of spectrum C′), thus giving contributions of weakly and strongly immobilized components into the experimental spectrum of 12-SASL from intact cortical and nuclear membranes.
