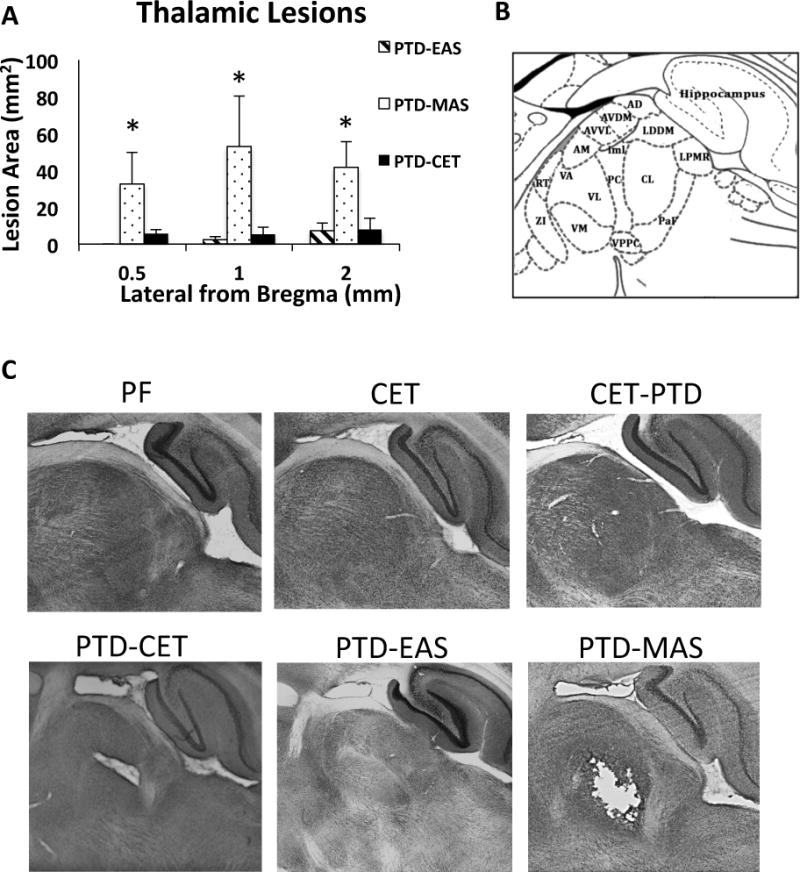
Figure 5.

Assessment of thalamic integrity in sagittal rat brain sections stain with NeuN. A. Average lesion area for groups that had lesions in thalamus (mean ± SEM). PTD-MAS rats show the greatest area of neuronal loss in the thalamus. B. Schematic of thalamic nuclei at 1.4 mm lateral from Bregma (Paxinos and Watson, 2013). C. Images of thalamus from each treatment group. Pair fed, CET and CET-PTD rats did not have lesions, while PTD-CET, PTD-EAS and PTD-MAS treatments produced lesions with PTD-MAS causing lesions with the greatest area. AD, anterodorsal nucleus; AM, anteromedial nucleus; AVDM, anteroventral nucleus dorsoventral; AVVL, anteroventral nucleus ventrolateral; CL, centrolateral nucleus; iml, internal medullary lamina ; LDDM, laterodorsal nucleus dorsomedial ; LPMR, lateral posterior nucleous ventral; PC, paracentral nucleus; PaF, parafascicular nucleus; RT, Reticular nucleous; ZI, Zona incerta. *p<0.05.
