Figure 5.
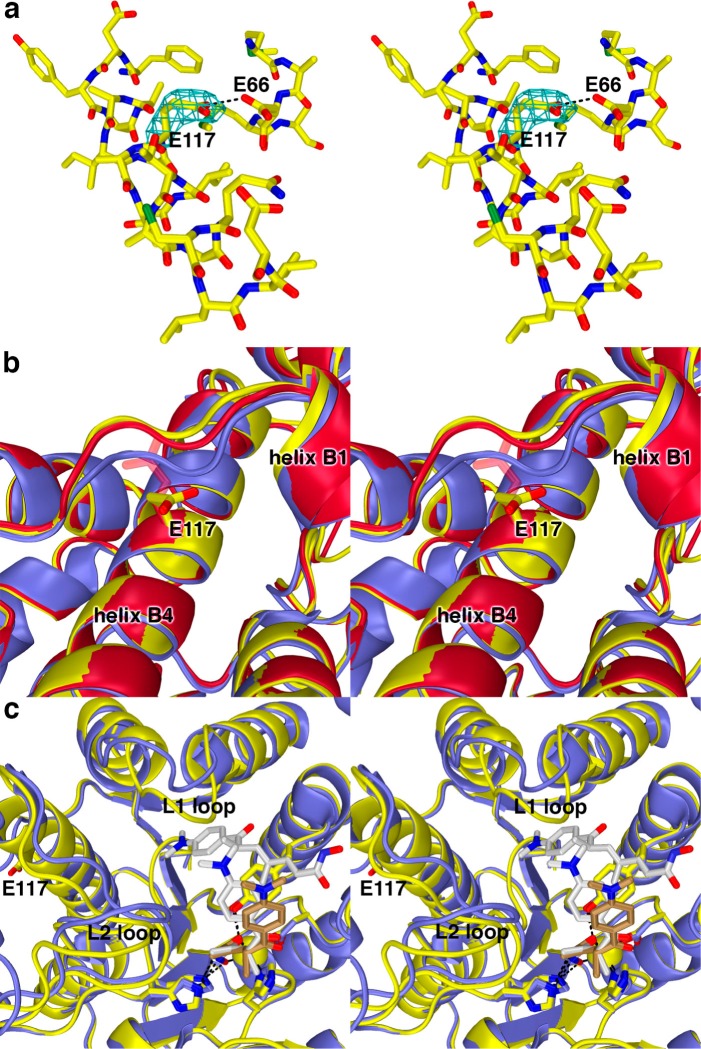
(a) Simulated annealing omit map (contoured at 2.2σ) showing the E117 side chain in the G117E HDAC8–TSA complex (monomer A). Atomic color code are as follows: C = yellow, N = dark blue, O = red, S = green. The side chain of E117 interacts with the side chain of E66; one of these residues is presumably protonated to accommodate this hydrogen bond. (b) Conformational changes induced by the G117E mutation in the nearby loop connecting β-strand 2 to helix B1 in monomers A (yellow) and B (red) of G117E HDAC8 in comparison with the wild-type HDAC8-TSA complex (blue) (PDB accession code 2V5W, monomer A). The side chain of E117 in monomer B is characterized by weak electron density and side chain atoms are not included in the final model after the Cβ atom. However, these unmodeled atoms are included in the figure as transparent sticks. (c) Comparison of the G117E HDAC8–TSA complex (monomer A, yellow; inhibitor, brown carbon atoms) with the wild-type HDAC8–TSA complex (monomer A, blue; inhibitor, white carbon atoms). Two TSA molecules bind to the wild-type enzyme, but only one molecule of TSA binds to G117E HDAC8. Significant conformational differences are observed in the L1 and L2 loops between the two structures.

