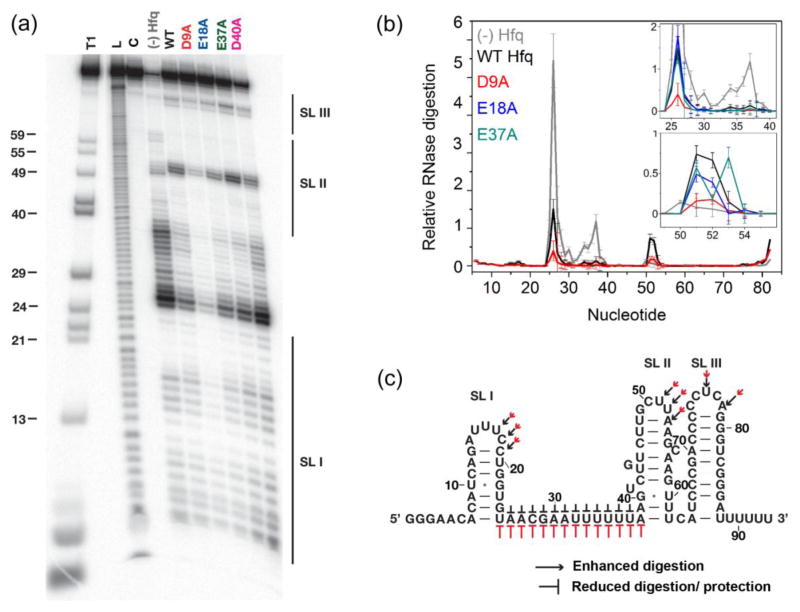
Fig. 3. Effect of acidic residues on DsrA recognition.
(a) Ribonuclease If footprinting of 5′-32P-labeled DsrA at 30 °C with no Hfq or with 10 μM Hfq monomer as shown. Lanes T1, L and C represent control reactions in urea with RNase T1 (T1), alkaline hydrolysis (L) and no treatment (C). The D40A variant forms unstable hexamers and these data were not analyzed further. (b) Relative RNase If digestion of nucleotides in DsrA. Gray, (−) Hfq; black, WT Hfq; red, D9A; (inset): blue, E18A; dark cyan, E37A. Lines and error bars trace the mean and S.D. of four trials (Methods). (c) Summary of nuclease digestion pattern on the secondary structure of DsrA. Pointed (→) and flat (⊥) arrows indicate enhancement or protection, respectively, while the size indicates the degree of change in the digestion pattern (Black, WT; red, Hfq:D9A).

