
Figure 5.
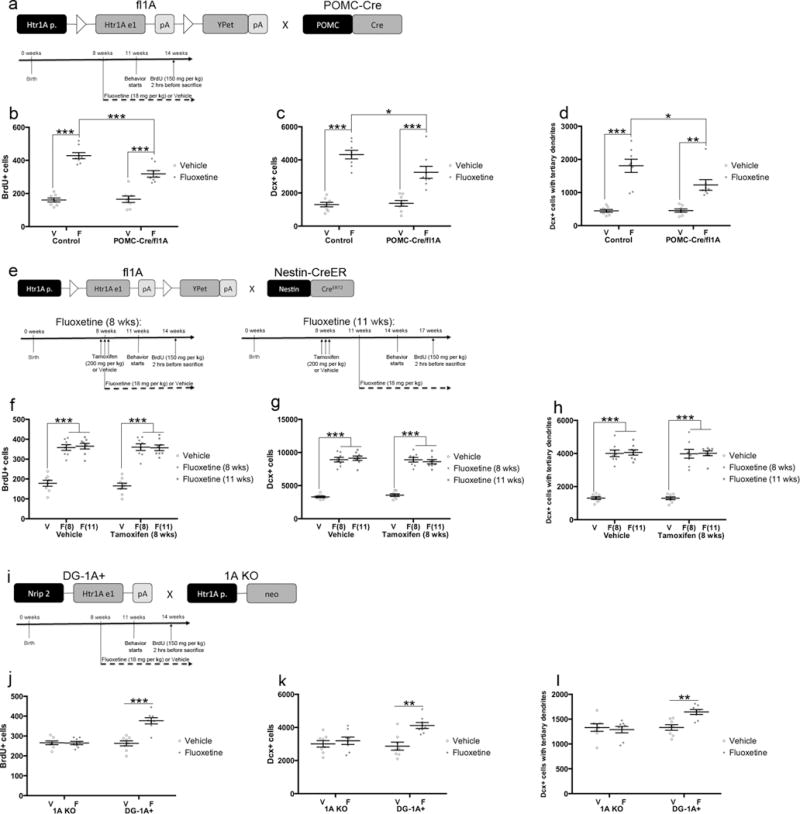
5HT1ARs in DG GCs are necessary and sufficient for the neurogenic effects of fluoxetine. a) Mice used for panels b–d were randomly chosen from behavioral cohort in Figure 1. n=8 per group. b) Proliferation results. The number of BrdU-positive cells was analyzed by Two-Way ANOVA (F(1,28)=10.66, p=.0029). *** indicates p<.0001 for Control Vehicle vs Fluoxetine and POMC-Cre/fl1A Vehicle vs Fluoxetine and p=.0007 for Control Fluoxetine vs POMC-Cre/fl1A Fluoxetine (Tukey’s). c) The number of young abGCs. The number of Dcx-positive cells was analyzed by Two-Way ANOVA (F(1,28)=5.292, p=.0291). *** indicates p<.0001, and * indicates p=.0247 for Control Fluoxetine vs POMC-Cre/fl1A Fluoxetine (Tukey’s). d) The number of young abGCs with tertiary dendrites. The number of Dcx-positive cells with tertiary dendrites was analyzed by Two-Way ANOVA (F(1,28)=4.954, p=.0343). *** indicates p<.0001, ** indicates p=.0015, and * indicates p=.0212 (Tukey’s). e) Mice used for panels f–h were randomly chosen from behavioral cohort in Figure 3. n=8 per group. f) Proliferation results. *** indicates p<.0001 (Two-Way ANOVA; treatment effect only) g) The number of young abGCs. *** indicates p<.0001 (Two-Way ANOVA; treatment effect only). h) The number of young abGCs with tertiary dendrites. *** indicates p<.0001 (Two-Way ANOVA; treatment effect only). i) Mice used for panels f–h were randomly chosen from behavioral cohort in Figure 4. n=8 per group. j) Proliferation results. The number of BrdU-positive cells was analyzed by Two-Way ANOVA (F(1,28)=23.7, p<.0001). *** indicates p<.0001 (Tukey’s). k) The number of young abGCs. The number of Dcx-positive cells was analyzed by Two-Way ANOVA (F(1,28)=6.311, p=.0180). ** indicates p=.0014 (Tukey’s). l) The number of young abGCs with tertiary dendrites. The number of Dcx-positive cells with tertiary dendrites was analyzed by Two-Way ANOVA (F(1,28)=8.031, p=.0084). ** indicates p=.0075 (Tukey’s). Mean lines and error bars throughout the figure represent mean ± SEM. V: Vehicle. F: Fluoxetine. F(8): Fluoxetine (8 wks). F(11): Fluoxetine (11 wks).