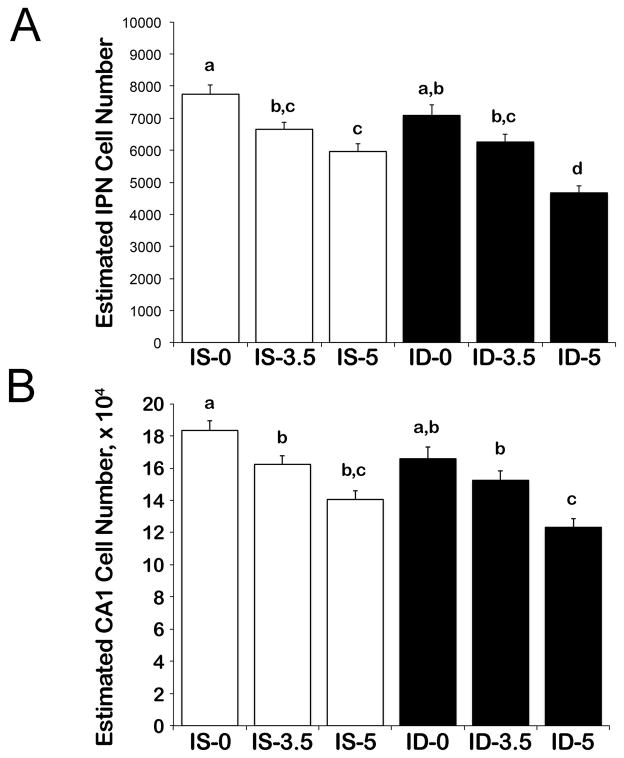
Figure 3.
Cellularity of the (A) Interpositus Nucleus (IPN) and (B) hippocampal CA1 regions of animals that underwent ECC testing. Data from delay and trace subjects were pooled as task did not affect cellularity. Cell count estimates represent unilateral values for each brain region ipsilateral to the trained eye. Values are means ± S.E.M., n = 20–24 animals per treatment group. Means without a common letter differ, p <0.05.

