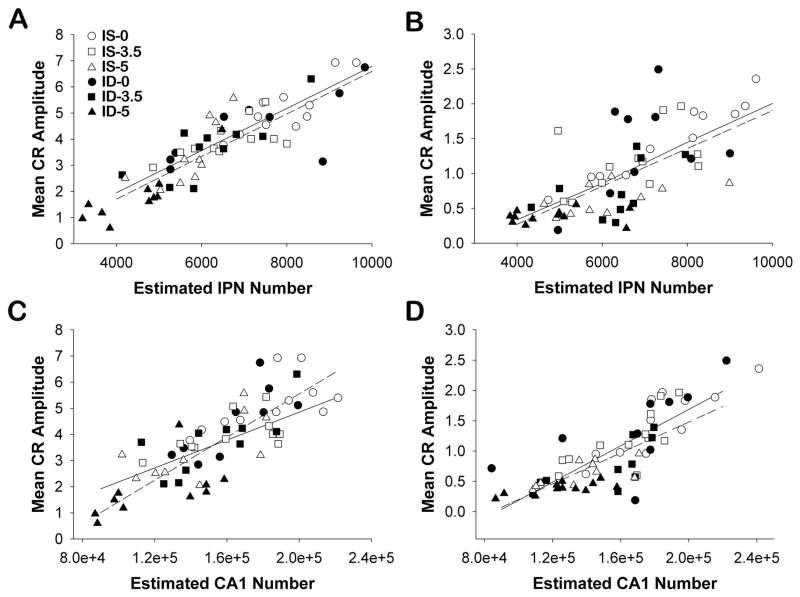
Figure 4.
Scatterplots of the unbiased estimated total neuron number and mean conditioned response amplitude (CR) across 6 sessions of eyeblink classical conditioning (ECC) for each rat. Interpositus nucleus (IPN) (A, B) and hippocampal CA1 (C, D) neuron cellularity for animals experiencing delay ECC (A, C) and trace ECC (B, D). Cell count estimates represent unilateral values for each brain region ipsilateral to the trained eye. Linear regressions are plotted for the IS (solid line) and ID (dotted line) animals across alcohol exposures and did not vary in slope or value.

