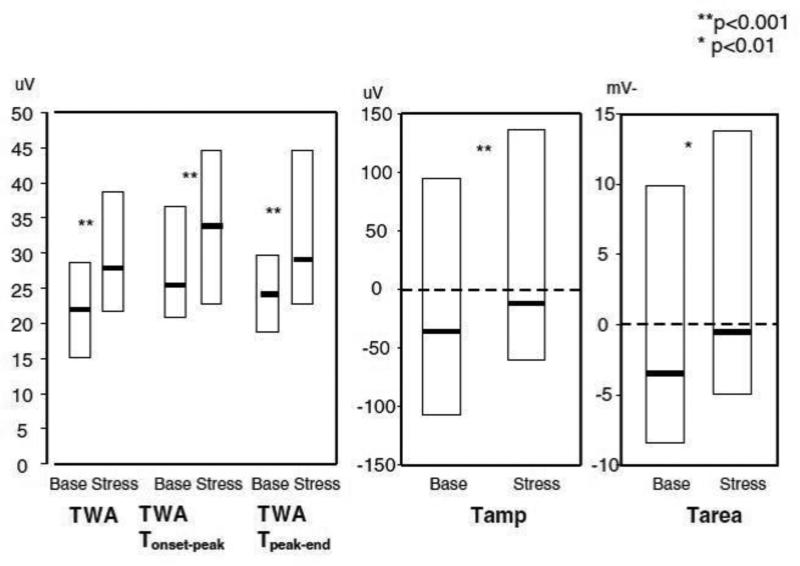
Figure 2. Changes in repolarization heterogeneity with mental stress.
Legend: Repolarization changes with mental stress. Box plots represent median and interquartile range. Tamp = T-wave amplitude; TWA = T-wave alternans; Tarea = T-wave area. Reprinted from Lampert, et al, J Cardiovasc Electrophys 2005, (ref 9) with permission

