
Figure 2. Estimated probabilities of transmission clusters harboring undiagnosed infections in the year following data collection based on a logistic growth model.
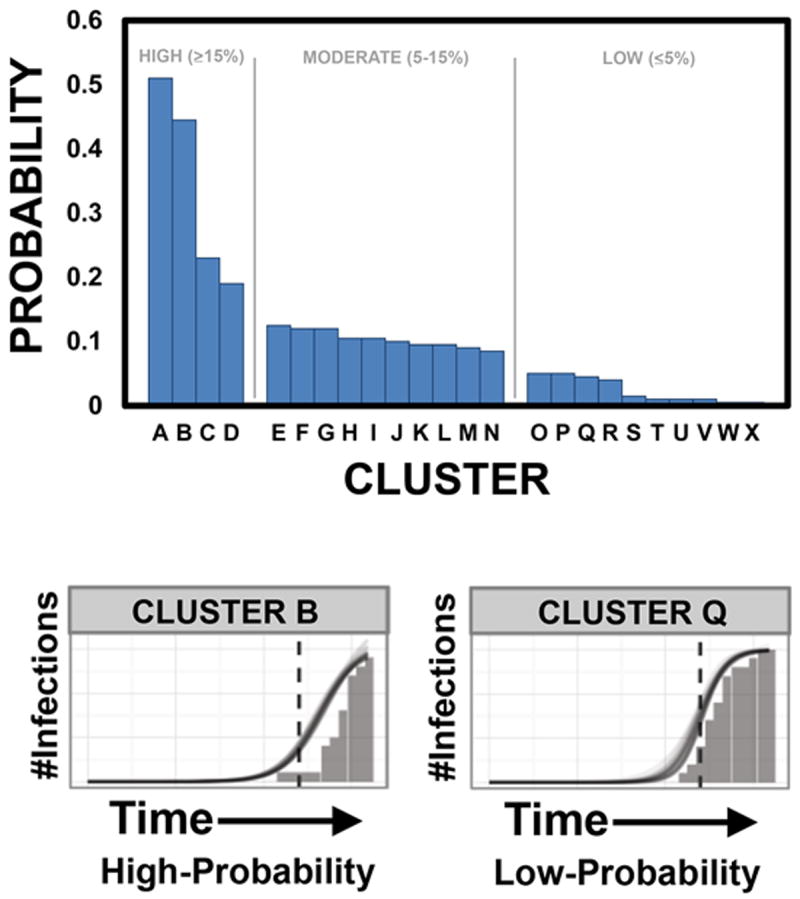
Bars demonstrate the 24 large clusters, ranked in descending order according to the highest probability of including an undiagnosed infection. Clusters with a high-probability (≥15%) of harboring undiagnosed infections in the following year are A-D; moderate-probability (5-15%) E-N; and low-probability (≤5%) O-X. Examples of high (Cluster B) and low (Cluster Q) probability clusters are shown at the bottom of the figure, demonstrating differing growth rates as represented by the slope of the line.