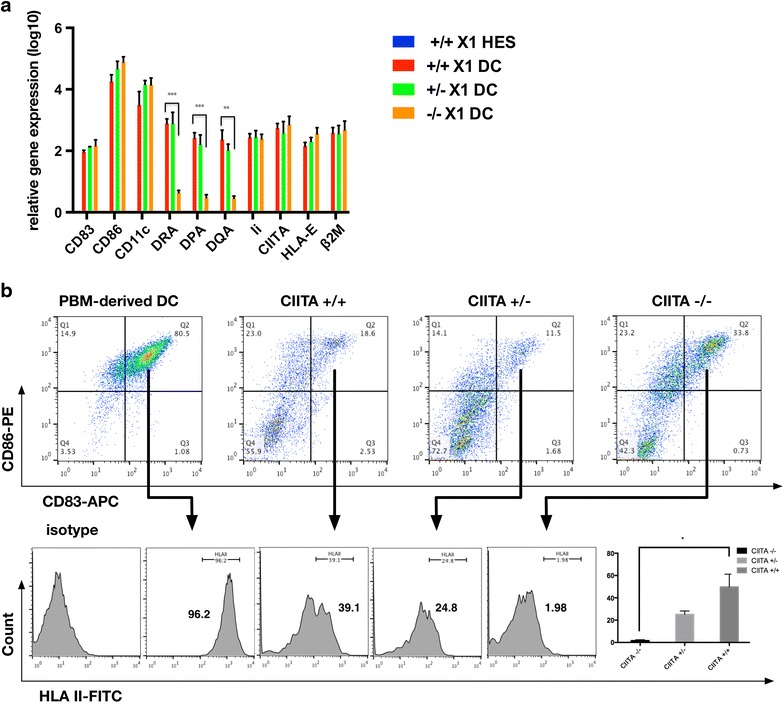
Fig. 4.

HLA Class II Expression in DCs derived from CIITA targeted hESCs. a RT-PCR analysis of CD83, CD86, CD11c, DRA, DPA, DQA, Ii, CIITA, HLA-E and β2M in DCs derived from CIITA-targeted hESCs. All groups were compared with CIITA +/+ hESCs group. b FACS analysis of HLA II expression in DCs, which were defined by the co-expression of CD83 and CD86. And compare the percentage of HLA II+. Significance was assessed by a t test. The data are expressed as the mean ± SEM, n ≥3. ***P < 0.001, ** P < 0.01, * P < 0.05
