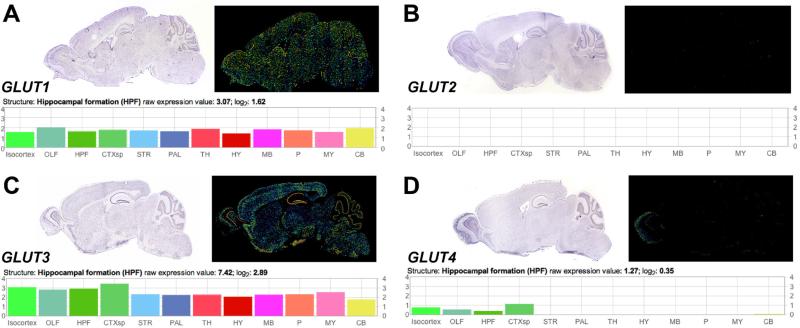
Figure 1. Absence of detectable GLUT2 detected in gene expression mapping of the mouse brain.
(A), The astroglial and endothelial glucose transporter GLUT1 is abundantly expressed in the mouse brain. Graph (below) depicts GLUT1 gene expression data from the Allen Brain Atlas. (B), No detectable GLUT2 mRNA was observed in any brain region. (C), The neuronal glucose transporter GLUT3 is widely expressed in the mouse brain. Graph (below) depicts regional comparison of gene expression data generated by the Allen Brain Institute. (D), Gene expression screening revealed lower levels of expression for the insulin-stimulated glucose transporter GLUT4. Graph (below) depicts GLUT4 gene expression data from the Allen Brain Atlas. Images and data were obtained from the Allen Institute for Brain Science website at www.alleninstitute.org.

