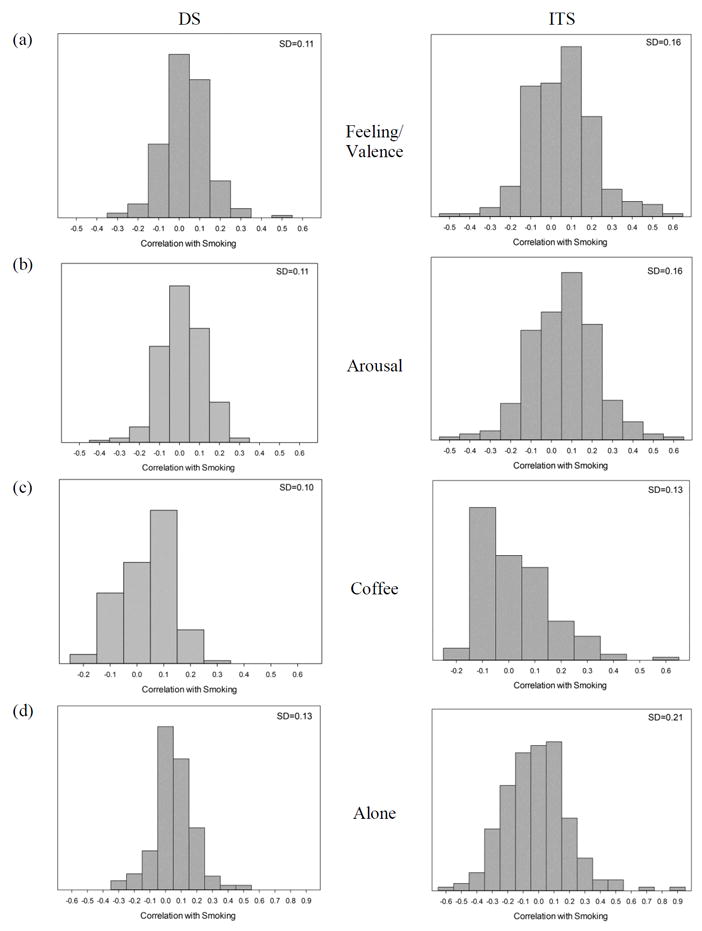
Figure 1. Correlations between smoking and various situational characteristics, among daily smokers (DS) and intermittent smokers (ITS).

The histograms show the range of correlations, at the level of individual subjects, between selected situational characteristics and smoking, shown separately for DS and ITS. The variables shown are (a) Feeling / valence (a rating of feelings from negative to positive); (b) Arousal (a factor score whose constituent items include “active,” “calm,” “quiet/sleepy,” and “energetic.”) (c) drinking coffee (no/yes) and (d) alone (no/yes). The figures illustrate that the associations vary widely, even when the average association is near 0. Note that the range of the x-axes is kept identical for DS and ITS within a given variable, but the scales differ across variables, to accommodate different ranges of observed correlations. Each graph also shows the standard deviation of the correlation coefficients shown in the histogram, illustrating that the associations observed among ITS are consistently more variable than those observed among DS.
