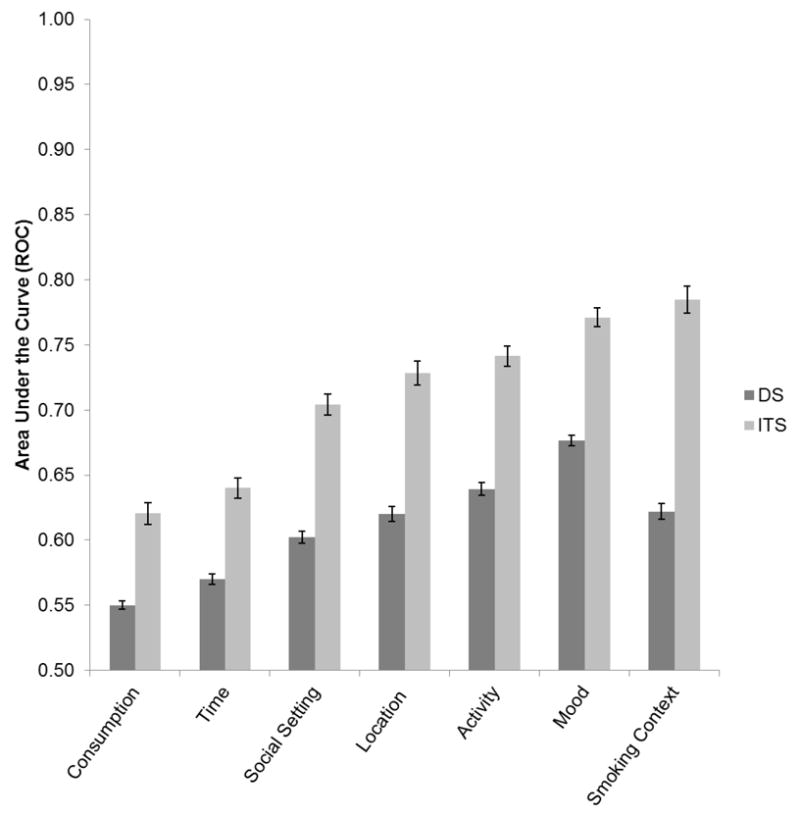
Figure 2. ROC values across situational domain and smoker group.

Average values for the Area Under the Curve of the Receiver Operating Curve (ROC), expressing the predictability of smoking from situational domains. ITS’ values were significantly higher for every domain, and all values were significantly greater than 0.5, the null value.
