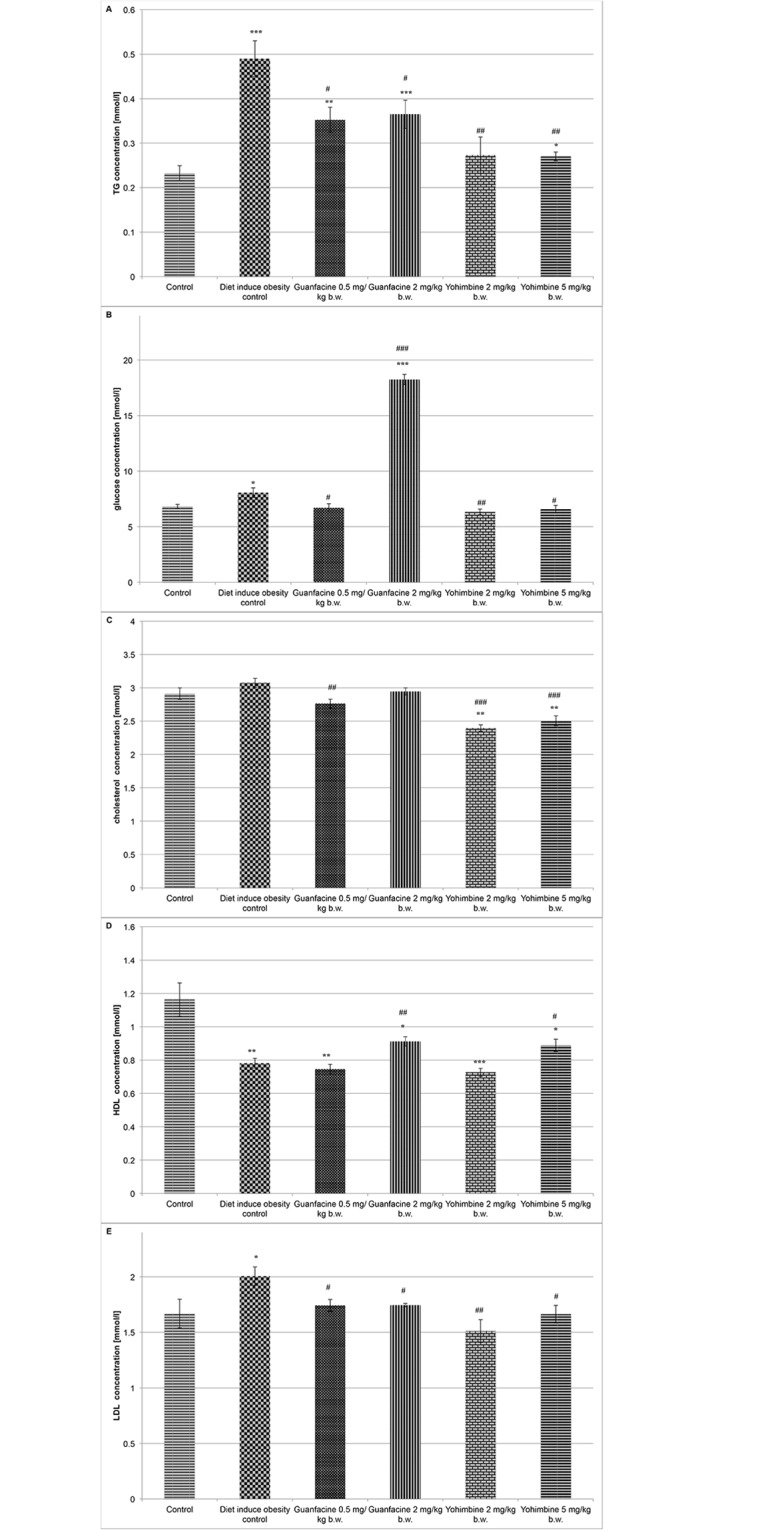
Fig 2. The effect of treatment with guanfacine and yohimbine on lipid and carbohydrate profile.

A. TG; B. Glucose; C. Total cholesterol; D. HDL-cholesterol; E. LDL-cholesterol; Control group—water; Diet-induced obesity control group—water; Yohimbine at 2 mg/kg b.w., i.p.; Yohimbine at 5 mg/kg b.w., i.p.; Guanfacine at 0.5 mg/kg b.w., i.p.; Guanfacine at 2 mg/kg b.w., i.p.; *Significant vs. control group, #—significant vs. diet-induced obese control group: *P<0.05, **P<0.01, ***P<0.001 (t-Student).
