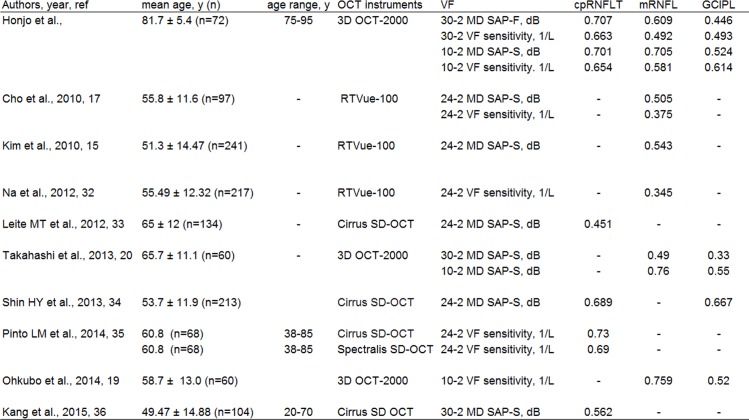
Fig 7. The reported correlation between visual field and OCT parameters in glaucoma subjects [15], [17], [19], [20], [32–36].
Values correspond to mean ± standard deviation unless otherwise noted. SAP-F: Humphrey Swedish Interactive Threshold Algorithm (SITA) Fast Strategy, SAP-S: Humphrey SITA Standard Strategy.

