
Fig 8. MapMan overview of cellular metabolism (a) and regulation (b)in OVR1-vs-OVR4.Each square represented a gene, and the color key represented the value of RPKM normalized log2.
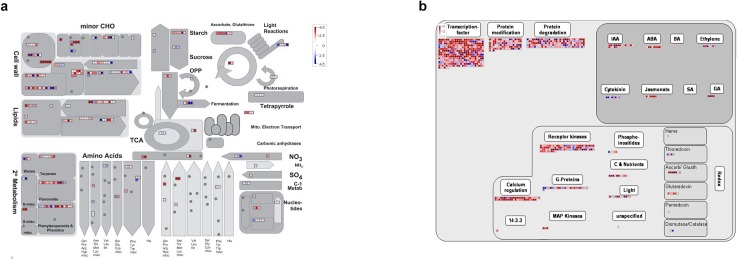
Red meant down-regulation of the gene and the blue color meant up-regulation.