
Fig 9. Hierarchical cluster analysis of gene expression based on log ratio RPKM data.
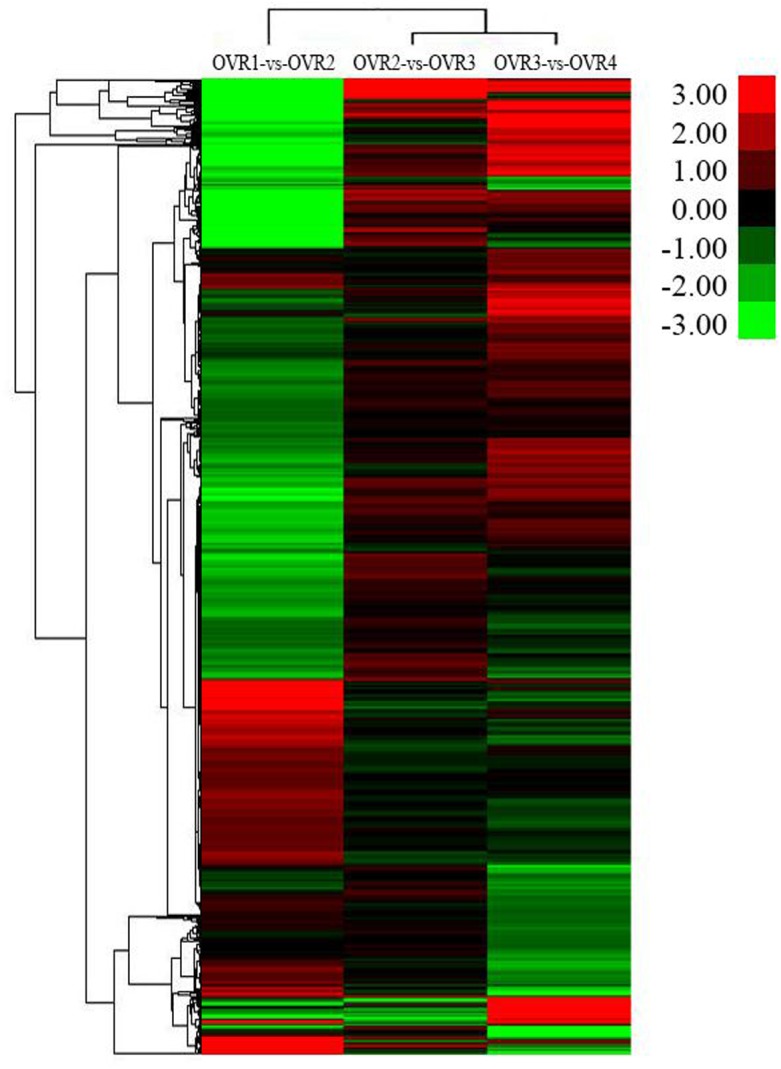
The color key represented RPKM normalized log2transformed counts. The green color represented lower expression, and the red color represented higher expression. Each column represented an experimental condition, each row represented a gene.