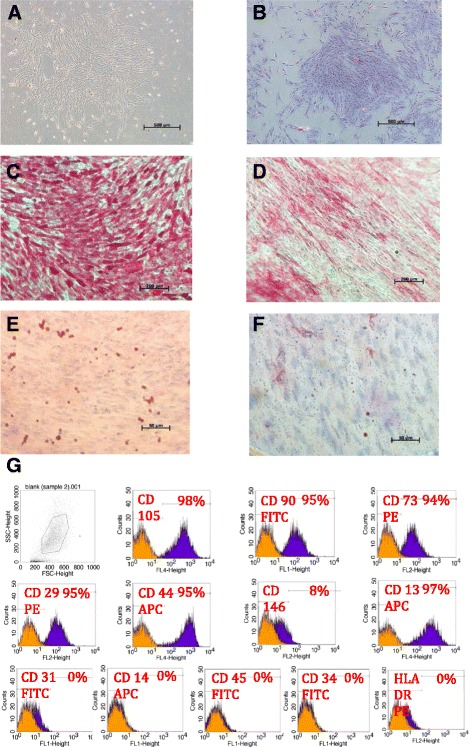
Fig. 1.

Inverted light microscopic images showing a dental pulp mesenchymal stem cells at primary culture, Magnification 5×. b Colony forming unit Fibroblast (CFU-F) magnification 5×, c, d Alkaline phosphatase staining for DPSCs 14 days after osteoinduction (c) versus negative control (d), magnification 10×, and Oil red O staining for DPSCs 14 days after adipogenic induction (e) versus negative control (f), magnification 40×. g FACS analysis results of a representative dental pulp cell line
