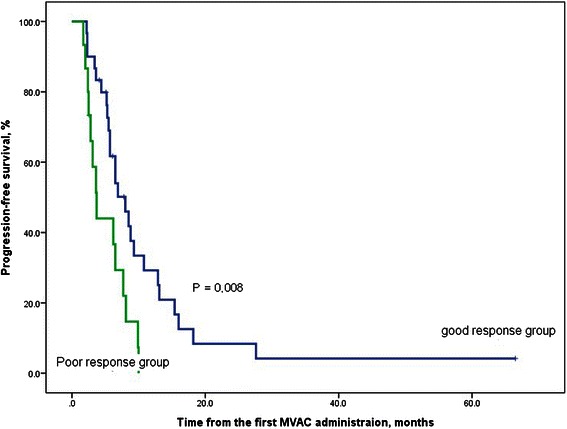
Fig. 1.

Kaplan-Meier curve for progression-free survival (%) in the good response and poor response groups. The good response group included patients who achieved a complete or partial response to first-line GP chemotherapy, whereas the poor response group included individuals with stable or progressive disease after first-line GP chemotherapy
